介紹如何使用 SimpleITK 的 LabelToRGBImageFilter 將標註影像(label image)轉換為 RGB 彩色影像,方便顯示於螢幕上。
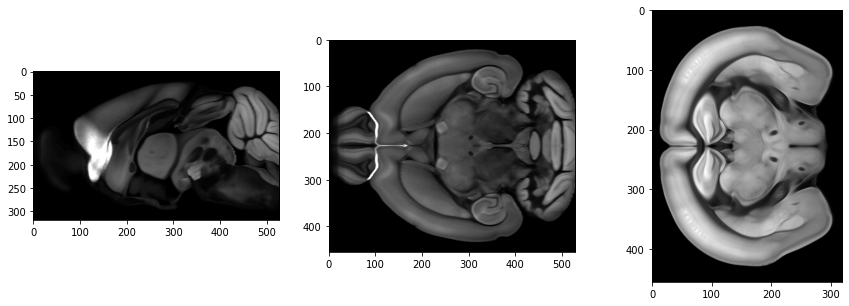
在標註影像的區域時,通常會將標註資訊儲存於另外一個標註檔案(label image)之中,跟原始影像搭配使用,以下是 Allen Mouse Brain CCFv3 平均腦與標註影像的範例。
import SimpleITK as sitk
import matplotlib.pyplot as plt

# 讀取平均腦影像檔案
avgImage = sitk.ReadImage("average_template/average_template_25.nrrd")

# 讀取影像標註檔案
anoImage = sitk.ReadImage("annotation/ccf_2017/annotation_25.nrrd")
平均腦影像可以直接以 matplotlib 顯示:
# 顯示影像切面
nda = sitk.GetArrayViewFromImage(avgImage)
fig, axs = plt.subplots(1, 3, figsize=(15, 5))
axs[0].imshow(nda[nda.shape[0]//2,:,:], cmap = 'gray')
axs[1].imshow(nda[:,nda.shape[1]//2,:], cmap = 'gray')
axs[2].imshow(nda[:,:,nda.shape[2]//2], cmap = 'gray')
plt.show()

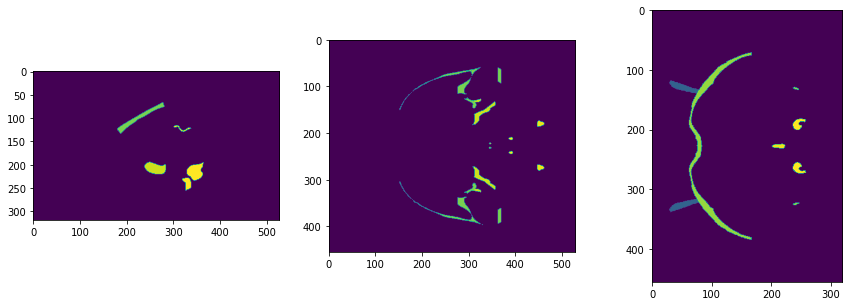
由於標註影像通常都是以不同的數值表示不同的標註區域,在查看標註影像時,若直接以普通的方式繪製,會造成許多區域因為數值過於相近,在套色之後無法區分,類似這樣:
# 顯示標註影像切面
nda = sitk.GetArrayViewFromImage(anoImage)
fig, axs = plt.subplots(1, 3, figsize=(15, 5))
axs[0].imshow(nda[nda.shape[0]//2,:,:])
axs[1].imshow(nda[:,nda.shape[1]//2,:])
axs[2].imshow(nda[:,:,nda.shape[2]//2])
plt.show()

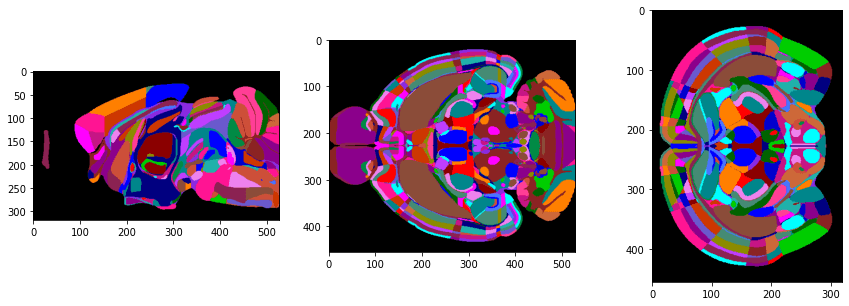
像這種多區域的標註影像,可以使用 SimpleITK 的 LabelToRGBImageFilter 將標註影像中不同的區域自動套上具有差異的顏色:
# 將標註影像轉為 RGB 影像(自動上色)
anoImageRGB = sitk.LabelToRGB(anoImage)
這樣畫出來之後就會非常容易辨識各區域的範圍:
# 顯示標註影像切面
nda = sitk.GetArrayViewFromImage(anoImageRGB)
fig, axs = plt.subplots(1, 3, figsize=(15, 5))
axs[0].imshow(nda[nda.shape[0]//2,:,:])
axs[1].imshow(nda[:,nda.shape[1]//2,:])
axs[2].imshow(nda[:,:,nda.shape[2]//2])
plt.show()


