Linux

Bash 程式設計教學與範例:feedgnuplot 命令列資料繪圖

介紹如何在 Linux 的終端機命令列中,使用 feedgnuplot 文字介面指令工具繪製各種資料圖形。

feedgnuplot 是一個文字模式的繪圖工具,可從標準輸入(standard input)讀取資料,搭配後端的 gnuplot 進行即時的繪圖,支援各類型的資料圖形。

若要在 Ubuntu Linux 中安裝 feedgnuplot,可以透過 apt 安裝:

# 安裝 feedgnuplot 套件
sudo apt install feedgnuplot

以下是 feedgnuplot 繪製各種圖形的使用範例。

折線圖

假設 data.txt 中的資料如下:

-3 0.064 0.053
-2 0.120 0.241
-1 0.176 0.398
0 0.199 0.241
1 0.176 0.053
2 0.120 0.004
3 0.064 0

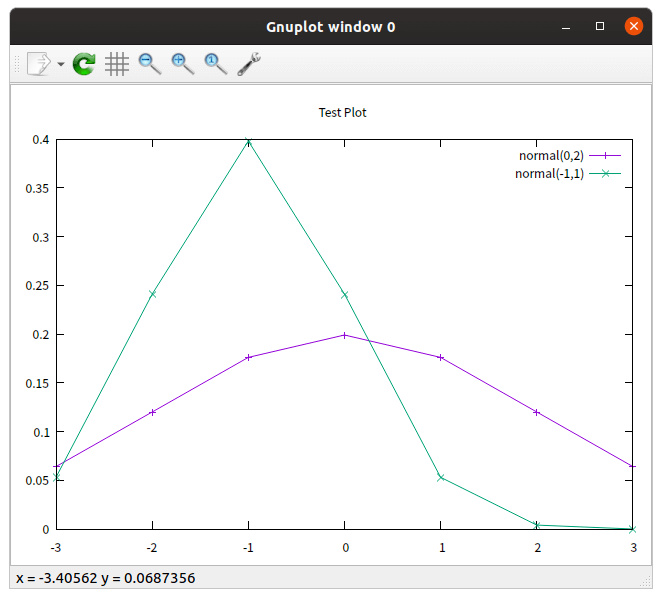
這個資料檔包含了兩組座標點資料,第一欄是共用的 x 座標,第二欄是第一個 y 座標,第三欄則是第二個 y 座標,若要將這樣的資料畫出來,可以使用以下指令:

# 繪製 data.txt 的資料(文字模式)
feedgnuplot --lines --points --domain --unset grid 
  --legend 0 "normal(0,2)" --legend 1 "normal(-1,1)" 
  --title "Test Plot" 
  --terminal 'dumb 80,30' 
  --exit < data.txt
                                     Test Plot                                  
                                                                                
   0.4 +--------------------------------------------------------------------+   
       |           +         #+ #         +          +           +          |   
       |                    #    ##                     normal(0,2) ***A*** |   
  0.35 |-+                 #       #                   normal(-1,1) ###B###-|   
       |                  #         #                                       |   
       |                ##           #                                      |   
   0.3 |-+             #              #                                   +-|   
       |              #                ##                                   |   
       |             #                   #                                  |   
  0.25 |-+          #                                                     +-|   
       |           B                      B                                 |   
       |          #                        #                                |   
   0.2 |-+       #                  ******A*#********                     +-|   
       |        #            *A*****         #       A****                  |   
       |       #          ***                 #           ***               |   
  0.15 |-+   ##         **                     #             ***          +-|   
       |    #        ***                        #               *           |   
       |   #     **A*                            #               A*****     |   
   0.1 |-+#  ****                                 #                    ****-|   
       | #***                                      #                       *|   
       |#                                           #                       |   
  0.05 |-+                                           B#####               +-|   
       |                                                   ####             |   
       |           +          +           +          +         ##+          |   
     0 +--------------------------------------------------------------------+   
      -3          -2         -1           0          1           2          3

feedgnuplot 的參數非常多,以下是各參數的說明:

  • --lines--points:分別代表繪製以「線條」與「點」的方式繪製資料。
  • --domain:代表第一欄為 x 軸,若沒有加上此參數,則第一欄會被視為另外一個 y 軸資料,而 x 軸的座標則以行號替代。
  • --legend:指定資料的標示文字,資料的編號是從 0 開始。
  • --title:指定圖形上方的標題文字。
  • --terminal:設定圖形輸出的形式,'dumb 80,30' 代表寬度 80、高度 30 的文字終端機,此處的寬度與高度可以自由調整。
  • --exit:畫完圖自動離開 feedgnuplot

如果是在 Linux 桌面環境中,也可以直接使用一般的圖形模式來畫圖(將 --terminal 參數拿掉),這樣圖形會更漂亮:

# 繪製 data.txt 的資料(圖形模式)
feedgnuplot --lines --points --domain --unset grid 
  --legend 0 "normal(0,2)" --legend 1 "normal(-1,1)" 
  --title "Test Plot" < data.txt
Gnuplot 視窗

這是將其他程式的輸出直接導入 feedgnuplot 進行繪圖的例子:

# 將資料導入 feedgnuplot 繪圖
seq 5 | awk '{print 2*$1, $1*$1}' | 
  feedgnuplot --lines --points 
    --legend 0 "data A" --title "Test Plot" 
    --unset grid --terminal 'dumb 80,30' 
    --exit
                                    Test Plot                                   
                                                                                
  25 +----------------------------------------------------------------------+   
     |        +        +        +        +       +        +        +     ## |   
     |                                                       data A ***##** |   
     |                                                               ##     |   
     |                                                             ##       |   
  20 |-+                                                         ##       +-|   
     |                                                         ##           |   
     |                                                       ##             |   
     |                                                     ##               |   
     |                                                   #B                 |   
  15 |-+                                              ###                 +-|   
     |                                             ###                      |   
     |                                           ##                         |   
     |                                        ###                           |   
  10 |-+                                   ###                          ****|   
     |                                  #B#                    *********    |   
     |                              ####              ****A****             |   
     |                          ####          ********                      |   
     |                       ###     ****A****                              |   
   5 |-+                 ####********                                     +-|   
     |             *###B#***                                                |   
     |    ****######                                                        |   
     |**######                                                              |   
     |##      +        +        +        +       +        +        +        |   
   0 +----------------------------------------------------------------------+   
     1       1.5       2       2.5       3      3.5       4       4.5       5   

使用 bash 指令稿從系統取得目前的網路流量資料,透過 feedgnuplot 繪製即時網路流量圖:

# 繪製即時網路流量圖
while true; do
  sleep 1;
  cat /proc/net/dev;
done |
  gawk '/ens3/ {if(b) {print $2-b; fflush()} b=$2}' |
  feedgnuplot --lines --stream --xlen 10 
  --ylabel 'Bytes/sec' --xlabel seconds 
  --terminal 'dumb 80,24' --unset grid
           4.5e+06 +--------------------------------------------------------+   
                   |     +          +           +          +          +     |   
             4e+06 |-+                                  ****              +-|   
                   |                      *****     ****   *                |   
           3.5e+06 |-+                    *    *  **        *             +-|   
                   |                     *      **          *               |   
             3e+06 |-+                   *                   *            +-|   
                   |                    *                    *              |   
           2.5e+06 |-+                  *                     *           +-|   
                   |                    *                     *             |   
                   |                   *                      *             |   
             2e+06 |-+                 *                       *          +-|   
                   |     **           *                        *            |   
           1.5e+06 |-+  *  **         *                         *         +-|   
                   |   *     *        *                         *           |   
             1e+06 |-+*              *                           *        +-|   
                   |  *       *****  *                           ***        |   
            500000 |-*             **                               **    +-|   
                   |*    +          *           +          +          +     |   
                 0 +--------------------------------------------------------+   
                         4          6           8          10         12        
                                            seconds

直方圖

以下是從 ping 指令擷取封包往返時間,導入 feedgnuplot 繪製直方圖的範例:

# 繪製封包往返時間直方圖
ping -A -D 8.8.8.8 |
  perl -anE 'BEGIN { $| = 1; }
             $F[0] =~ s/[[]]//g or next;
             $F[7] =~ s/.*=//g    or next;
             say "$F[0] $F[7]"' |
  feedgnuplot --stream --domain --histogram 0 --binwidth 3 
              --xlabel 'Ping round-trip time (s)'  
              --ylabel Frequency --xlen 20 
              --terminal 'dumb 80,24' --unset grid
           30 +-------------------------------------------------------------+   
              |     + ********** +     +     +     +     +      +     +     |   
              |       *        *                                            |   
           25 |-+     *        *                                          +-|   
              |       *        *                                            |   
              |       *        *                                            |   
           20 |-+     *        *                                          +-|   
              |       *        *                                            |   
              |       *        *                                            |   
           15 |-+     *        *                                          +-|   
              |       *        *                                            |   
              |       *        *                                            |   
              |       *        *                                            |   
           10 |-+     *        *                                          +-|   
              |       *        *                                            |   
              |       *        *                                            |   
            5 |-+     *        **********                                 +-|   
              |       *        *        *                                   |   
              |     + *   +    * +     +***********+     +      +   ********|   
            0 +-------------------------------------------------------------+   
              2     4     6      8     10    12    14    16     18    20    22  
                                 Ping round-trip time (s)

時間序列圖

以下是一個擷取 CPU 閒置比例資訊,交給 feedgnuplot 繪製時間序列資料圖的範例:

# 繪製時間序列資料圖
export LANG=C
sar 1 -1 | 
  awk '$1 ~ /..:..:../ && $8 ~/^[0-9.]*$/ {print $1,$8; fflush()}' | 
  feedgnuplot --stream --domain 
              --lines --timefmt '%H:%M:%S' 
              --set 'format x "%H:%M:%S"' 
              --terminal 'dumb 80,24' --unset grid
  100 +---------------------------------------------------------------------+   
      |     **    + ******************** +           +          +    *      |   
   95 |-+  * *      *                   *                            *    +-|   
      |       *    *                    *                            *      |   
      |       *    *                     *                          *       |   
   90 |-+      *   *                     *                          *     +-|   
      |        ****                       *                         *       |   
   85 |-+         *                       *                         *     +-|   
      |                                   *                         *       |   
      |                                   *                         *       |   
   80 |-+                                  *        ****           *      +-|   
      |                                    *      **   *           *        |   
   75 |-+                                   *     *    *           *      +-|   
      |                                      *   *      *         *         |   
      |                                      *   *      *         *         |   
   70 |-+                                     ***       *        *        +-|   
      |                                         *       *       *           |   
   65 |-+                                                *  ** *          +-|   
      |                                                  ***  *             |   
      |           +          +           +           +   *      +           |   
   60 +---------------------------------------------------------------------+   
  09:44:10    09:44:15   09:44:20    09:44:25    09:44:30   09:44:35    09:44:40
Share
Published by
Office Guide
Tags: Bash

Recent Posts

Python 使用 PyAutoGUI 自動操作滑鼠與鍵盤

本篇介紹如何在 Python ...

9 個月 ago

Ubuntu Linux 以 WireGuard 架設 VPN 伺服器教學與範例

本篇介紹如何在 Ubuntu ...

9 個月 ago

Linux 網路設定 ip 指令用法教學與範例

本篇介紹如何在 Linux 系...

9 個月 ago

Windows 使用 TPM 虛擬智慧卡保護 SSH 金鑰教學與範例

本篇介紹如何在 Windows...

11 個月 ago

Linux 以 Shamir’s Secret Sharing 分割保存金鑰教學與範例

介紹如何在 Linux 中使用...

11 個月 ago

Linux 以 Cryptsetup、LUKS 加密 USB 隨身碟教學與範例

介紹如何在 Linux 系統中...

11 個月 ago