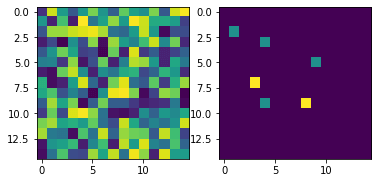
介紹如何使用 ITK 的 LabelStatisticsImageFilter 套用遮罩影像計算各種統計量,包含體積(數量)、加總、平均值、變異數、範圍等。
建立測試影像與遮罩影像
首先使用亂數的方式建立測試用的原始影像,並且手動建立一張測試用的遮罩影像:
import itk
import numpy as np
import matplotlib.pyplot as plt

# 建立測試影像
np.random.seed(1)
testArray = np.random.randint(0, 255, (15, 15)).astype(np.uint8)

# 建立測試用遮罩
maskArray = np.zeros((15, 15), dtype=np.uint8)
maskArray[2,1] = 1
maskArray[3,4] = 1
maskArray[5,9] = 1
maskArray[9,4] = 1
maskArray[7,3] = 2
maskArray[9,8] = 2

# 顯示影像與遮罩
fig, axes = plt.subplots(1, 2)
axes[0].imshow(testArray)
axes[1].imshow(maskArray)

從 NumPy 陣列建立 ITK 影像:
# 從 NumPy 陣列建立 ITK 影像
testImage = itk.GetImageFromArray(testArray)
maskImage = itk.GetImageFromArray(maskArray)
套用遮罩影像計算統計量
有了原始影像與遮罩影像之後,就可以使用 LabelStatisticsImageFilter 將遮罩照用在原始影像上計算物件的各種基本統計量:
# 影像類型
PixelType = itk.UC
Dimension = 2
ImageType = itk.Image[PixelType, Dimension]

# 建立 LabelStatisticsImageFilter
statFilter = itk.LabelStatisticsImageFilter[ImageType,ImageType].New()
statFilter.SetInput(testImage)       # 原始影像
statFilter.SetLabelInput(maskImage)  # 標註影像
statFilter.Update()

# 輸出統計結果
for label in statFilter.GetValidLabelValues():
    print("label", label)
    print("  Count =", statFilter.GetCount(label))
    print("  Bounding Box =", statFilter.GetBoundingBox(label))
    print("  Min =", statFilter.GetMinimum(label))
    print("  Max =", statFilter.GetMaximum(label))
    print("  Sum =", statFilter.GetSum(label))
    print("  Mean =", statFilter.GetMean(label))
    print("  Variance =", statFilter.GetVariance(label))
label 1
  Count = 4
  Bounding Box = (1, 9, 2, 9)
  Min = 7.0
  Max = 226.0
  Sum = 508.0
  Mean = 127.0
  Variance = 12144.666666666666
label 2
  Count = 2
  Bounding Box = (3, 8, 7, 9)
  Min = 76.0
  Max = 143.0
  Sum = 219.0
  Mean = 109.5
  Variance = 2244.5
label 0
  Count = 219
  Bounding Box = (0, 14, 0, 14)
  Min = 1.0
  Max = 254.0
  Sum = 27786.0
  Mean = 126.87671232876713
  Variance = 5690.402161618701

