節點標示符號
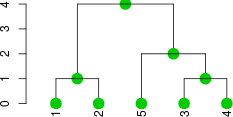
set 亦可用來調整節點符號的屬性:
# 調整節點符號屬性
dend %>% set("nodes_pch", 19) %>% # 樣式
  set("nodes_cex", 2) %>%         # 大小
  set("nodes_col", 3) %>%         # 顏色
  plot
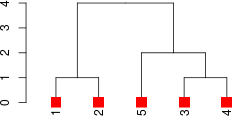
若只要調整 leaves 節點符號的屬性,則執行:
# 調整 leaves 節點符號屬性
dend %>% set("leaves_pch", 15) %>% # 樣式
  set("leaves_cex", 2) %>%         # 大小
  set("leaves_col", 2) %>%         # 顏色
  plot
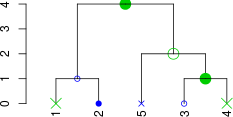
我們也可以個別指定每個節點的屬性值:
# 個別指定每個節點的屬性
dend %>% set("nodes_pch", c(19, 1, 4)) %>%
  set("nodes_cex", c(2, 1)) %>%
  set("nodes_col", c(3, 4)) %>%
  plot
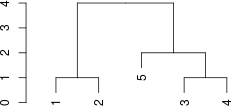
若要修正 leaves 節點的高度,可以使用 hang.dendrogram 函數:
# 修正 leaves 節點高度
dend %>% hang.dendrogram(hang_height = .6) %>% plot
枝幹
樹狀圖的枝幹線條屬性也可以自由調整:
# 調整枝幹屬性
dend %>% set("branches_lwd", 4) %>% # 寬度
  set("branches_lty", 3) %>%        # 樣式
  set("branches_col", 2) %>%        # 顏色
  plot
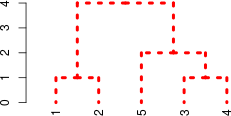
亦可個別定每一條枝幹的屬性:
# 個別指定每一條枝幹屬性
dend %>% set("branches_lwd", c(4, 1)) %>% # 寬度
  set("branches_lty", c(1, 1, 3)) %>%        # 樣式
  set("branches_col", c(1, 2, 3)) %>%        # 顏色
  plot
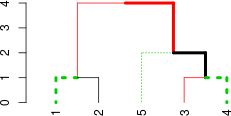
設定枝幹顏色的時候,同樣可以搭配 k 參數指定分群數量,將每一群分別設定為不同的顏色:
# 分群上色
dend %>% set("branches_k_color", k = 3) %>% plot
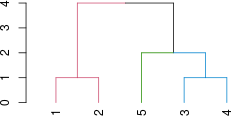
也可以自行指定配色:
# 自行指定各群顏色
dend %>% set("branches_k_color", value = 3:1, k = 3) %>% plot
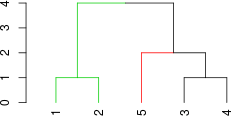
若要根據節點的文字標示來標示枝幹,可以執行:
# 根據文字標示上色
dend %>% set("by_labels_branches_col", value = c(1,4)) %>% plot
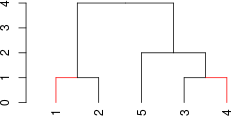
如果要根據文字標示,標示從跟節點到末端的每一條枝幹,則可將 type 參數設定為 any:
# 根據文字標示上色
dend %>% set("by_labels_branches_col", value = c(1,4), type = "any") %>% plot
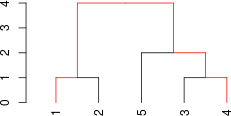
文章撰寫中…
參考資料:dendextend vignettes、The R Graph Gallery、stackoverflow
頁次: 頁次 1 頁次 2

