介紹如何在 Python 中使用 Pydicom 模組讀取與寫入 DICOM 格式的波形資料。
在 DICOM 的標準中,有許多的 IOD 都有包含波形的資料,例如 12-Lead ECG、Respiratory Waveform 與 Real-Time Audio Waveform,這些 IOD 都使用 Waveform Module 來儲存一條或多條波形的資料。
DICOM 格式的波形資料範例檔案,可以從 Pydicom 的 GitHub 網站上下載,或是 NEMA 的 FTP 站下載。
首先以 dcmread 函數讀取 DICOM 檔案:
from pydicom import dcmread

# 讀取 DICOM 檔案
ds = dcmread("waveform_ecg.dcm")
顯示 DICOM 的 SOP Class UID 與 SOP Class Name:
# 顯示 SOP Class UID 與 SOP Class Name
print(ds.SOPClassUID)
print(ds.SOPClassUID.name)
1.2.840.10008.5.1.4.1.1.9.1.1
12-lead ECG Waveform Storage
取得波形(wafeform)資料:
# 取得波形(wafeform)資料
waveforms = ds.WaveformSequence
查看波形資料數量:
# 波形資料數量
print(len(waveforms))
取得第一組波形資料:
# 第一組波形資料
multiplex = waveforms[0]

# Multiplex Group Label (003A,0020)
print(multiplex.MultiplexGroupLabel)
RHYTHM
# Sampling Frequency (003A,001A)
print(multiplex.SamplingFrequency)
1000
# Number Of Waveform Channels (003A,0005)
print(multiplex.NumberOfWaveformChannels)
12
# Number of Waveform Samples (003A,0010)
print(multiplex.NumberOfWaveformSamples)
10000
# 顯示波形各頻道資訊
for ii, channel in enumerate(multiplex.ChannelDefinitionSequence):
    source = channel.ChannelSourceSequence[0].CodeMeaning
    units = 'unitless'
    if 'ChannelSensitivity' in channel:  # Type 1C, may be absent
        units = channel.ChannelSensitivityUnitsSequence[0].CodeMeaning
    print(f"Channel {ii + 1}: {source} ({units})")
Channel 1: Lead I (Einthoven) (microvolt)
Channel 2: Lead II (microvolt)
Channel 3: Lead III (microvolt)
Channel 4: Lead aVR (microvolt)
Channel 5: Lead aVL (microvolt)
Channel 6: Lead aVF (microvolt)
Channel 7: Lead V1 (microvolt)
Channel 8: Lead V2 (microvolt)
Channel 9: Lead V3 (microvolt)
Channel 10: Lead V4 (microvolt)
Channel 11: Lead V5 (microvolt)
Channel 12: Lead V6 (microvolt)
若要取得實際的波形資料,要先查看資料的編碼類型:
# Waveform Bits Allocated (5400,1004)
print(multiplex.WaveformBitsAllocated)
16
# Waveform Sample Interpretation (5400,1006)
print(multiplex.WaveformSampleInterpretation)
SS
根據 Waveform Bits Allocated 與 Waveform Sample Interpretation 的資訊,然後對照 DICOM 的規格表,Waveform Bits Allocated 是 16,而 Waveform Sample Interpretation 則是 SS,則對應的資料格式則是 signed 16 bits。
查看原始資料(raw)長度:
# 原始資料長度
print(len(multiplex.WaveformData))
240000
波形的原始資料是以各頻道交錯排列儲存的,以這個例子來說,資料結構會像這樣:
(Ch 1, Sample 1), (Ch 2, Sample 1), ..., (Ch 12, Sample 1),
(Ch 1, Sample 2), (Ch 2, Sample 2), ..., (Ch 12, Sample 2),
...,
(Ch 1, Sample 10,000), (Ch 2, Sample 10,000), ..., (Ch 12, Sample 10,000)
若要將 DICOM 中的波形資料轉為 NumPy 的 ndarray 格式,可以使用 multiplex_array() 函數:
from pydicom.waveforms import multiplex_array

# 轉為 NumPy 的 ndarray
raw = multiplex_array(ds, 0, as_raw = True)

# 存取波形資料
print(raw[0, 0])
80
若在 DICOM 中存在 (003A,0210) Channel Sensitivity 這個標籤,則原始的數值必須經過校正後才是真實的數值,校正的公式為:
當 multiplex_array() 的 as_raw 參數指定為 False 的時候,就會自動進行這項校正。
我們也可以使用 waveform_array() 來取得校正後的波形資料:
# 取得校正後的波形資料
arr = ds.waveform_array(0)

# 存取校正後的波形資料
print(arr[0, 0])
100
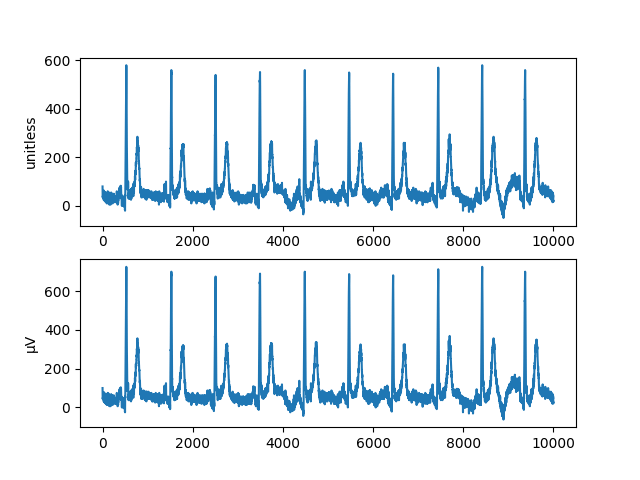
以 matplotlib 繪製原始與校正後的波形圖:
import matplotlib.pyplot as plt

# 繪製原始與校正後的波形圖
fig, (ax1, ax2) = plt.subplots(2)
ax1.plot(raw[:, 0])
ax1.set_ylabel("unitless")
ax2.plot(arr[:, 0])
ax2.set_ylabel("μV")
plt.show()
這裡我們示範將 cosine 與 sine 的曲線資料以 signed 16 bit 的格式儲存在 DICOM 中(亦可 DICOM 的規格表選擇其他類型的資料格式)。
產生 cosine 與 sine 函數的波形資料:
import numpy as np

# 產生 cosine 與 sine 波形資料
x = np.arange(0, 4 * np.pi, 0.1)
ch1 = (np.cos(x) * (2**15 - 1)).astype('int16')
ch2 = (np.sin(x) * (2**15 - 1)).astype('int16')
建立 DICOM 的 multiplex 群組:
from pydicom.dataset import Dataset

# 建立 DICOM 的 multiplex 群組
new = Dataset()
new.WaveformOriginality = "ORIGINAL"
new.NumberOfWaveformChannels = 2
new.NumberOfWaveformSamples = len(x)
new.SamplingFrequency = 1000.0
在 DICOM 的 Waveform Module 規範中,Type 1 的標籤是必要的,Type 1C 則是在某些條件下必須提供,而 Type 2 則是一定要提供,但是可以是空值,而 Type 3 則是可有可無。
設定各頻道的定義,這裡只是示範用的資料,在實務上應該要使用正式的 Coding Schemes。
# 設定各頻道的定義
new.ChannelDefinitionSequence = [Dataset(), Dataset()]
chdef_seq = new.ChannelDefinitionSequence
for chdef, curve_type in zip(chdef_seq, ["cosine", "sine"]):
    chdef.ChannelSampleSkew = "0"
    chdef.WaveformBitsStored = 16
    chdef.ChannelSourceSequence = [Dataset()]
    source = chdef.ChannelSourceSequence[0]
    source.CodeValue = "1.0"
    source.CodingSchemeDesignator = "PYDICOM"
    source.CodingSchemeVersion = "1.0"
    source.CodeMeaning = curve_type
將波形資料轉成頻道交錯的格式,另外由於這裡 dataset 的 transfer syntax 是 little endian,所以若在 big endian 的環境中,就必須處理 endian 轉換的問題。我們可以使用 import sys; print(sys.byteorder) 來檢查自己的環境是屬於哪一種。
# 將波形資料轉成頻道交錯的格式
arr = np.stack((ch1, ch2), axis = 1)
new.WaveformData = arr.tobytes()
print(arr.shape)
(126, 2)
另外也要設定 Waveform Bits Allocated 與 Waveform Sample Interpretation 的值,讓其符合儲存的資料格式:
new.WaveformBitsAllocated = 16
new.WaveformSampleInterpretation = 'SS'
加入新的波形資料:
# 加入新的波形資料
ds.WaveformSequence.append(new)
儲存為 DICOM 檔案:
# 儲存為 DICOM 檔案
ds.save_as("my_waveform.dcm")
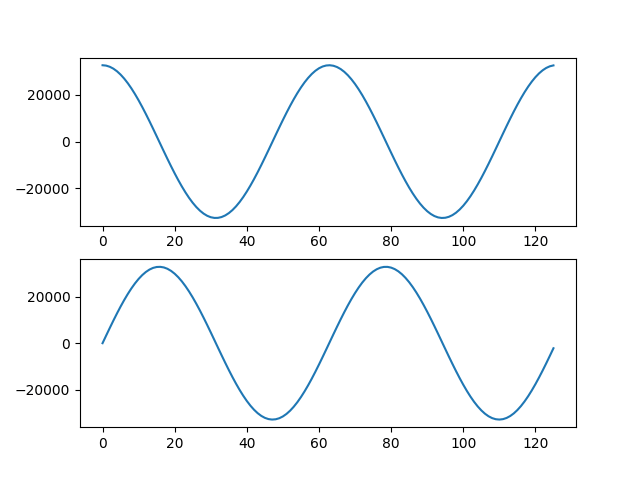
最後讀取 DICOM 檔案中的波形資料,並繪製圖形:
# 讀取 DICOM 檔案中的波形資料,並繪製圖形
ds = dcmread("my_waveform.dcm")
arr = ds.waveform_array(2)
fig, (ax1, ax2) = plt.subplots(2)
ax1.plot(arr[:, 0])
ax2.plot(arr[:, 1])
plt.show()