介紹如何在 R 中使用 ggplot2 的 ggpomological 果樹水彩畫佈景主題繪圖。
ggpomological 果樹水彩畫佈景主題ggpomological 是一個適用於 ggplot2 繪圖系統的果樹水彩畫佈景主題,其色盤設計來自於美國國家農業圖書館(USDA National Agricultural Library)上面的水彩畫,套用至 ggplot2 的圖形之後,可以讓圖片呈現類似水彩的風格。
ggpomological 的作者從這些果樹水彩畫中,以 ColorSchemer Studio 軟體萃取出圖片的主要色盤,再經過自己的篩選之後,建立出適合繪圖的主要配色與背景顏色。
ggpomological 套件ggpomological 並沒有被收錄在官方的 CRAN 套件庫中,若要安裝 ggpomological 佈景主題套件,必須透過 devtools 從 GitHub 安裝:
# 安裝 devtools 套件
install.packages("devtools")

# 安裝 ggpomological 套件
devtools::install_github("gadenbuie/ggpomological")
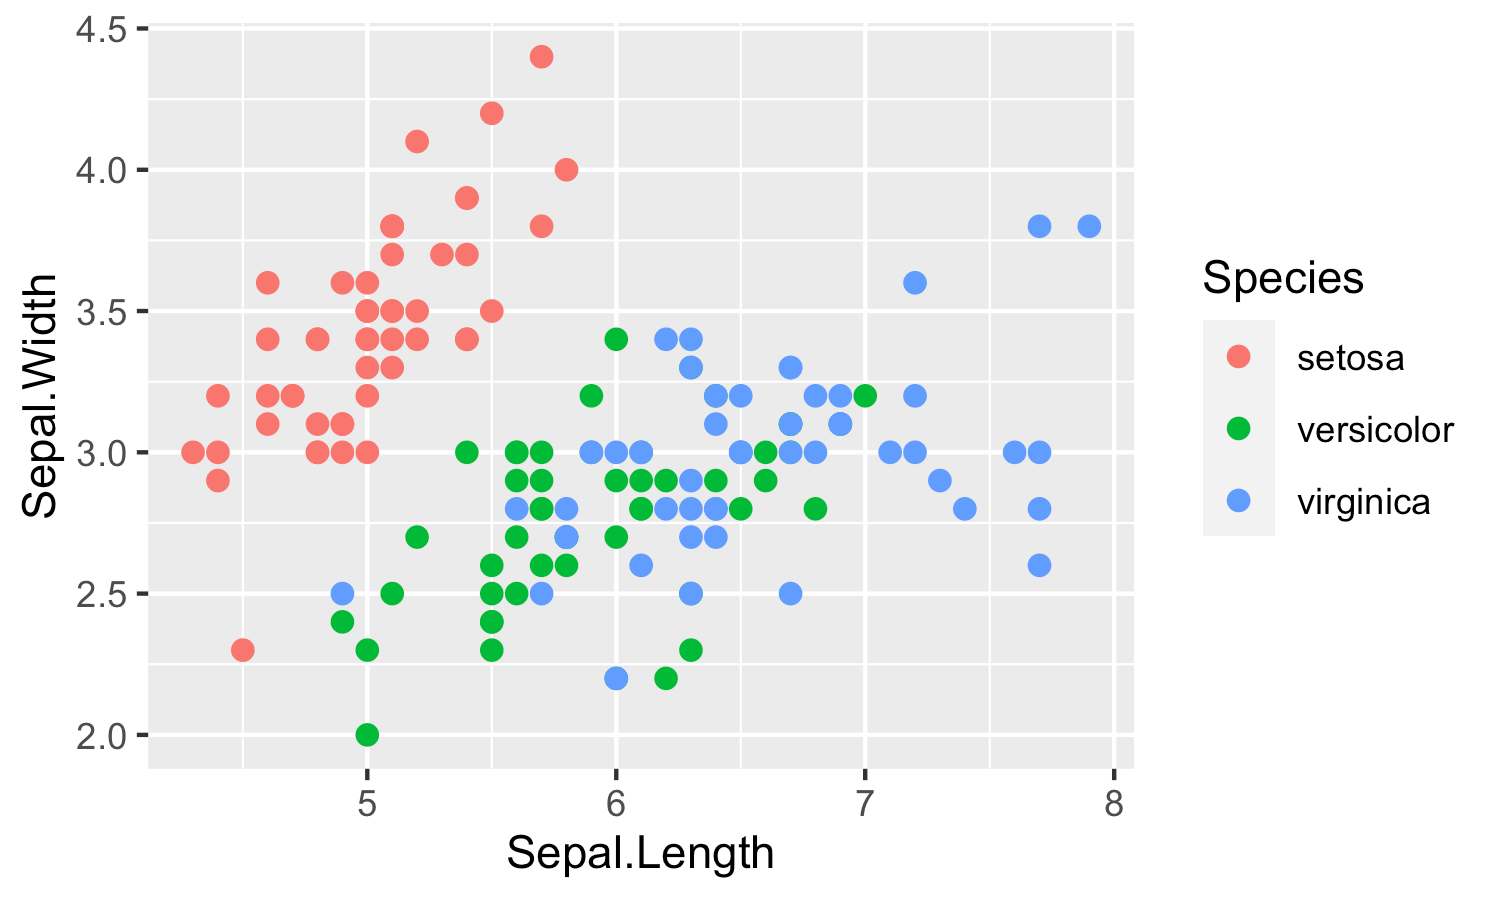
ggpomological 色盤與佈景主題先以 ggplot2 建立基本的散佈圖(scatter plot):
library(ggpomological)
library(dplyr)

# 基本圖形
p <- ggplot(iris) +
  aes(x = Sepal.Length, y = Sepal.Width, color = Species) +
  geom_point(size = 2)
p
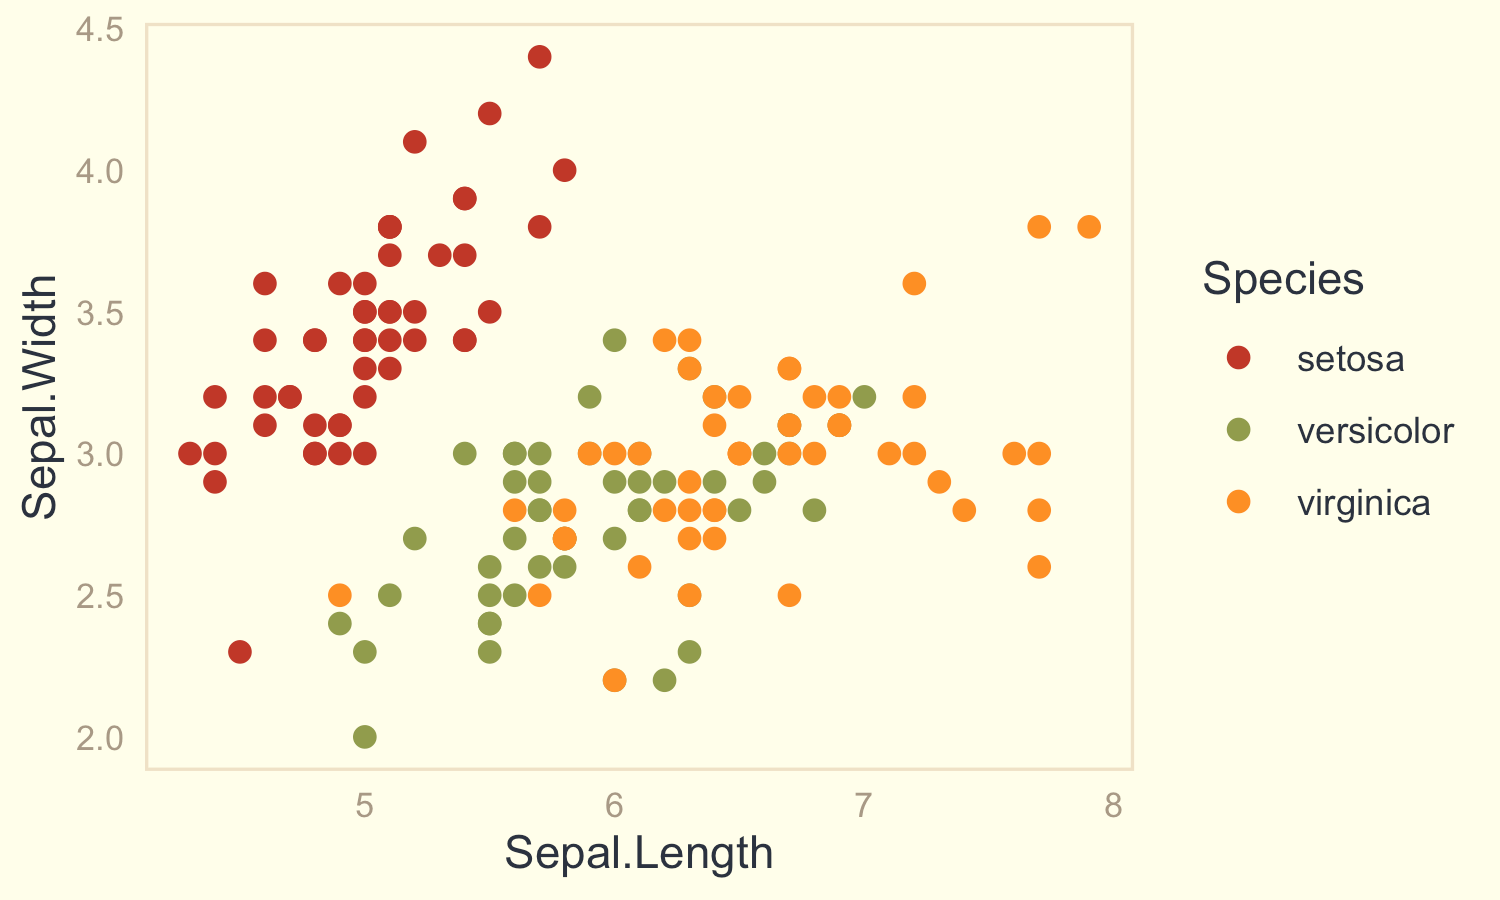
套用 ggpomological 所提供的色盤:
# 套用 ggpomological 色盤
p + scale_color_pomological()
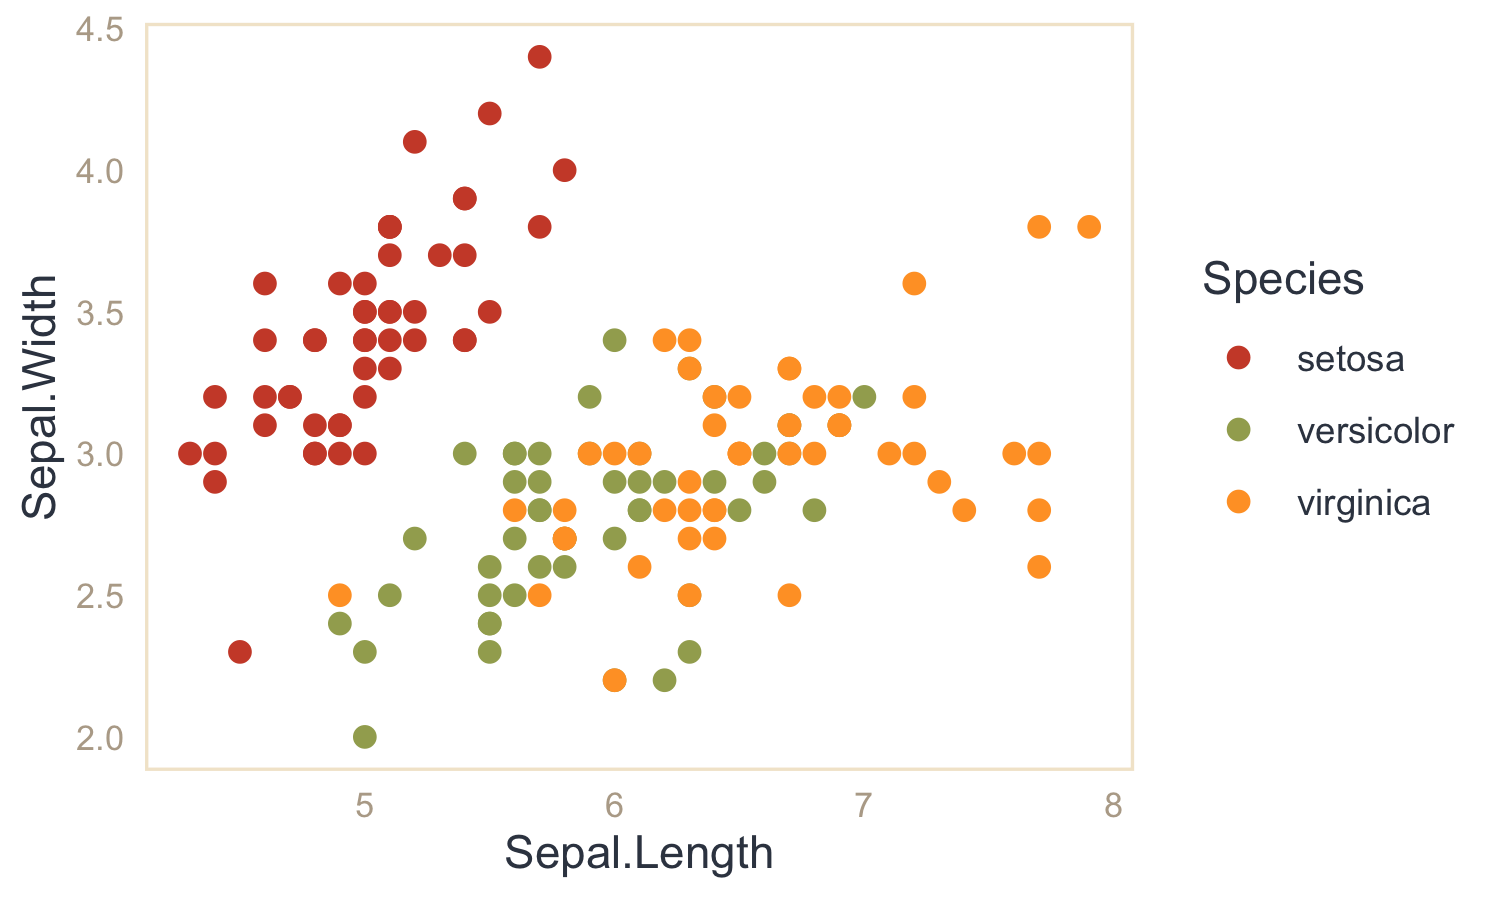
ggpomological 色盤套用 ggpomological 色盤與佈景主題:
# 套用 ggpomological 色盤與佈景主題
p + scale_color_pomological() +
  theme_pomological()
ggpomological 色盤與佈景主題套用 ggpomological 色盤,並使用透明背景:
# 套用 ggpomological 色盤,並使用透明背景
p + scale_color_pomological() +
  theme_pomological_plain()
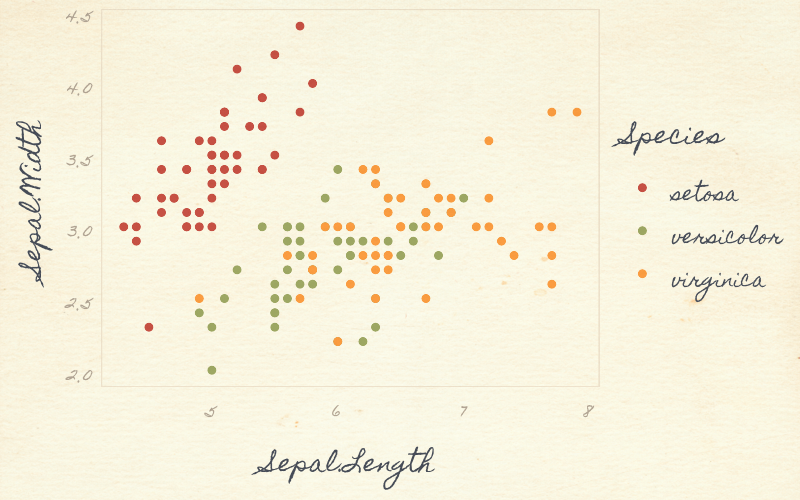
ggpomological 色盤,使用透明背景ggpomological 要搭配手寫的英文字型,才比較能顯現水彩畫的質感,但英文手寫字型需要另外安裝。
下載並在系統上安裝 Homemade Apple 手寫字型之後,在 R 中以 extrafont 套件的 font_import 將字型匯入:
# 匯入新字型
extrafont::font_import()
接著即可使用 theme_pomological_fancy() 佈景主題搭配手寫字型繪圖:
# 使用 Homemade Apple 手寫字型
p2 <- p + scale_color_pomological() +
  theme_pomological_fancy()
p2
theme_pomological_fancy() 預設會使用 Homemade Apple 字型繪圖,也可以自行以其 base_family 參數指定別的字型。
以下是幾個適合用於繪圖的 Google 字型:
另外也可以參考 Google 的手寫字型分類。
paint_pomological() 函數可以將圖形加入背景圖片,搭配 magick 輸出成圖片檔:
# 加入背景圖片,輸出圖檔
paint_pomological(p2, res = 110) %>%
  magick::image_write("output.png")
若要自行指定背景圖片,可以使用 paint_pomological() 函數的 pomological_background 參數來指定背景圖片檔案。
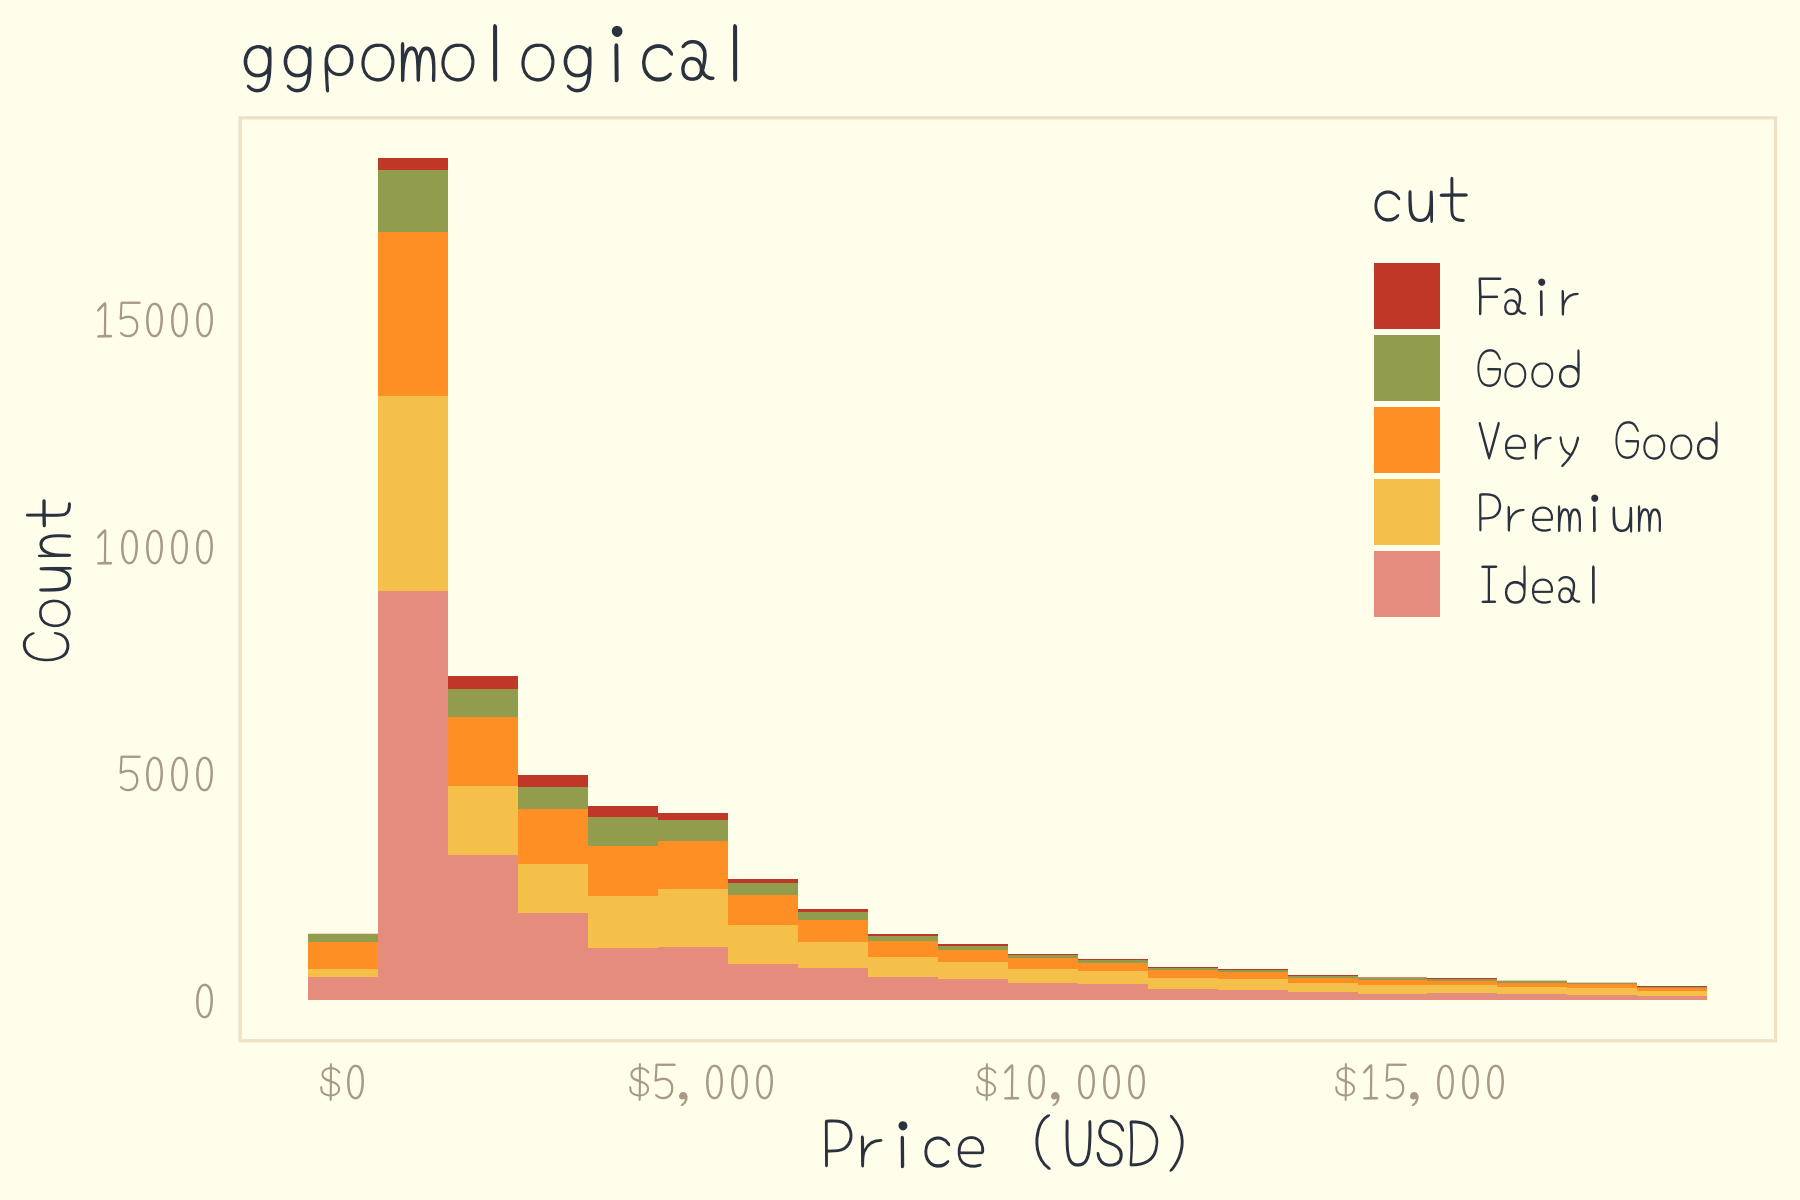
ggpomological 色盤與佈景主題以下是直方圖套用 ggpomological 色盤與佈景主題的例子:
# 基本直方圖
p <- ggplot(diamonds) +
  aes(price, fill = cut) +
  geom_histogram(bins = 20) +
  xlab('Price (USD)') +
  ylab('Count') +
  ggtitle("ggpomological") +
  scale_x_continuous(label = scales::dollar_format())

# 套用 ggpomological 色盤與佈景主題,並指定字型
p <- p + scale_fill_pomological() +
  theme_pomological("Yomogi", 16) +
  theme(legend.position = c(0.85, 0.7))

# 儲存圖片
ggsave("output.png", p, width = 6, height = 4)
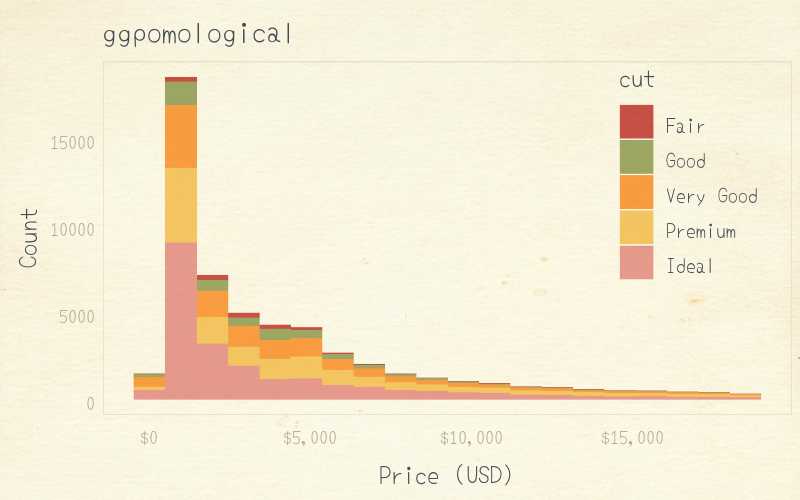
ggpomological 色盤與佈景主題# 加入背景圖片,輸出圖檔 paint_pomological(p, res = 110) %>% magick::image_write("output.png")
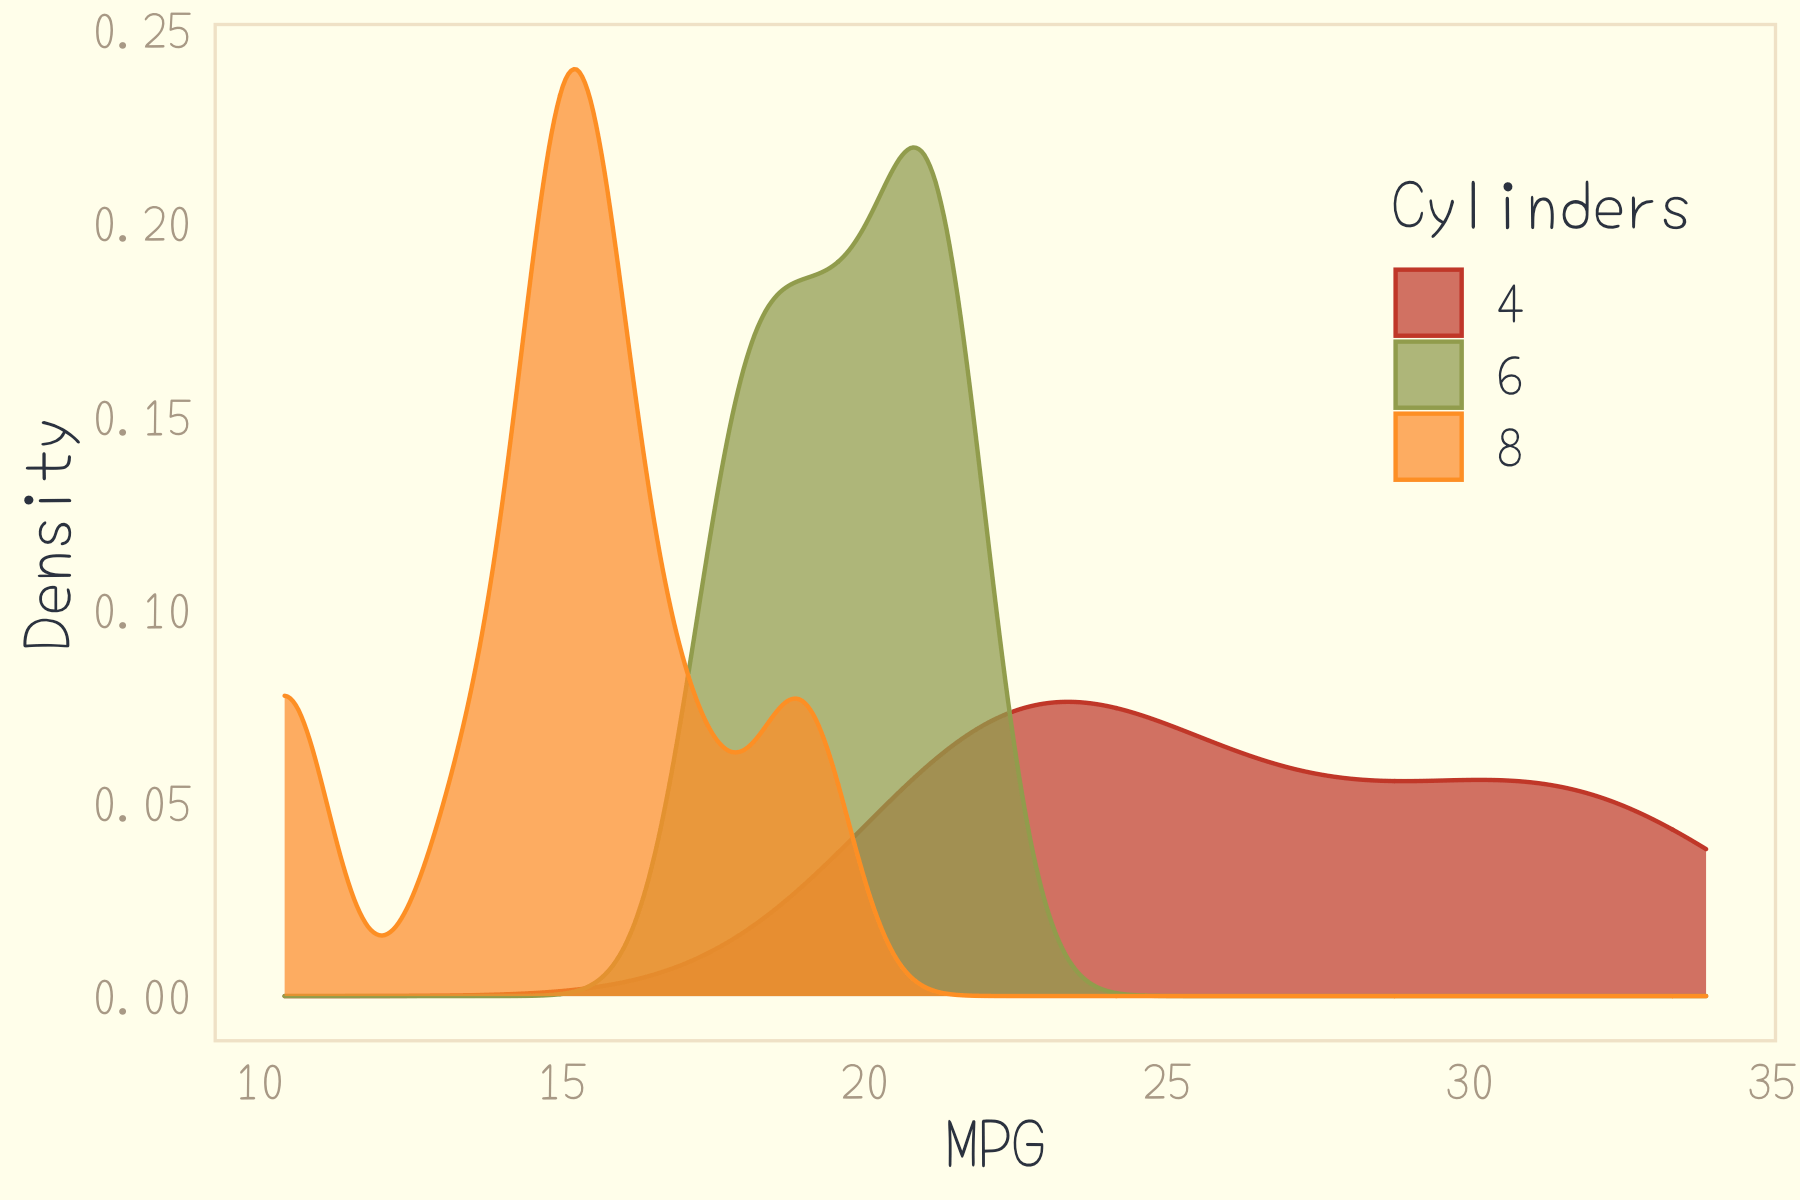
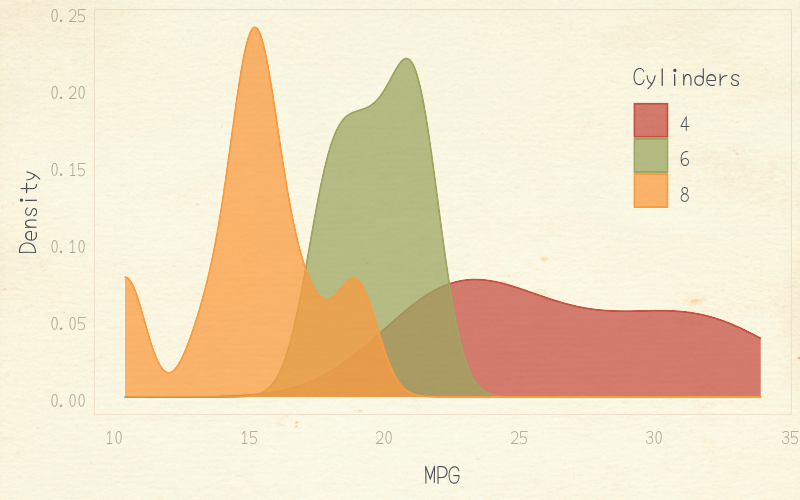
ggpomological 色盤與佈景主題以下是密度圖套用 ggpomological 色盤與佈景主題的範例:
# 基本密度圖
p <- mtcars %>%
  mutate(cyl = factor(cyl)) %>%
  ggplot() +
  aes(mpg, fill = cyl, color = cyl) +
  geom_density(alpha = 0.75) +
  labs(fill = 'Cylinders', colour = 'Cylinders', x = 'MPG', y = 'Density')

# 套用 ggpomological 色盤與佈景主題,並指定字型
p <- p + scale_color_pomological() +
  scale_fill_pomological() +
  theme_pomological("Yomogi", 16) +
  theme(legend.position = c(0.85, 0.7))

# 儲存圖片
ggsave("output.png", p, width = 6, height = 4)
ggpomological 色盤與佈景主題# 加入背景圖片,輸出圖檔 paint_pomological(p, res = 110) %>% magick::image_write("output.png")
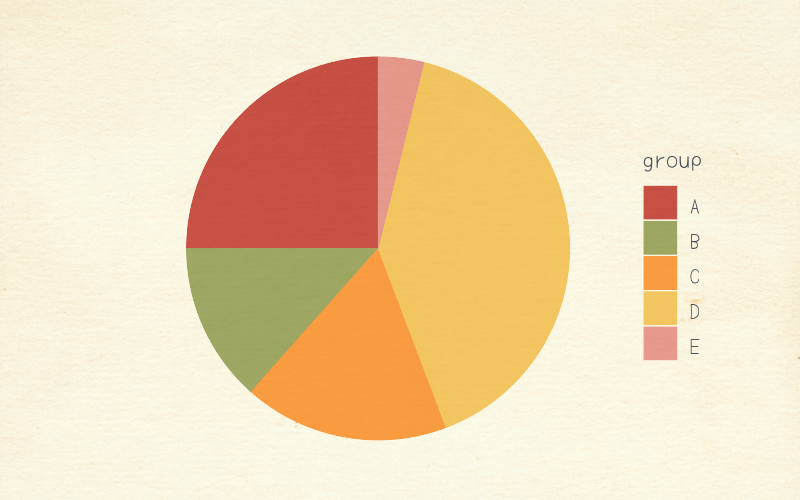
ggpomological 色盤與佈景主題以下是圓餅圖套用 ggpomological 色盤與佈景主題的範例:
# 測試資料
data <- data.frame(
  group = LETTERS[1:5],
  value = c(13, 7, 9, 21, 2)
)

# 建立基本圓餅圖
p <- ggplot(data, aes(x = "", y = value, fill = group)) +
  geom_bar(stat = "identity", width = 1) +
  coord_polar("y", start = 0) +
  theme_pomological(base_family = 'Yomogi', base_size = 16) +
  scale_fill_pomological() +
  theme(axis.title.x = element_blank(),
        axis.text.x = element_blank(),
        axis.ticks.x = element_blank(),
        panel.border = element_blank()) +
  labs(x = "")

# 加入背景圖片,輸出圖檔
paint_pomological(p, res = 110) %>%
  magick::image_write("output.png")
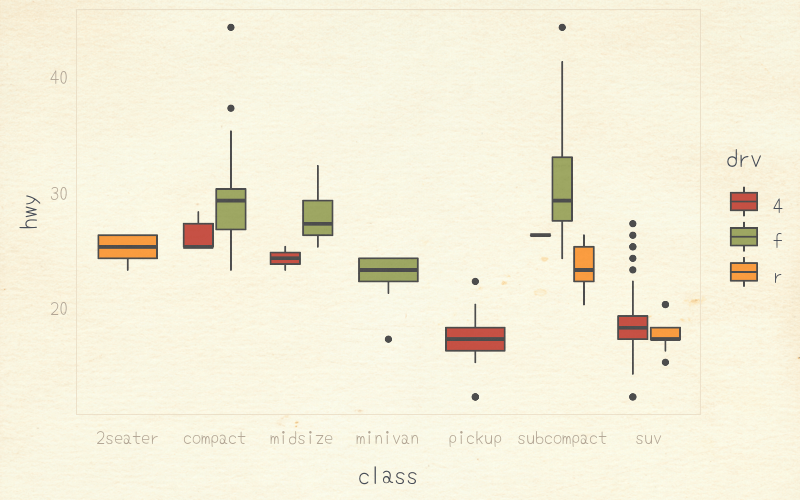
ggpomological 色盤與佈景主題ggpomological 色盤與佈景主題以下是箱形圖套用 ggpomological 色盤與佈景主題的範例:
# 建立箱形圖
p <- ggplot(mpg, aes(x = class, y = hwy, fill = drv)) +
  geom_boxplot() +
  scale_fill_pomological() +
  theme_pomological("Yomogi", 16)

# 加入背景圖片,輸出圖檔
paint_pomological(p, res = 110) %>%
  magick::image_write("output.png")
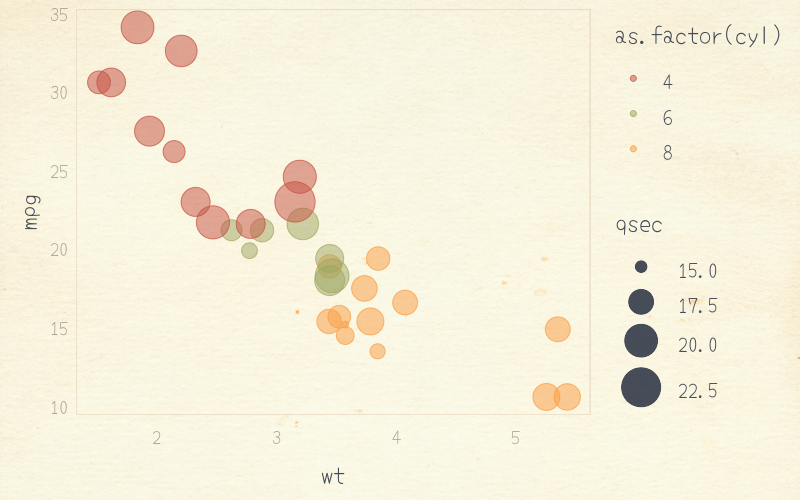
ggpomological 色盤與佈景主題ggpomological 色盤與佈景主題以下是泡沫圖套用 ggpomological 色盤與佈景主題的範例:
# 建立泡沫圖
p <- ggplot(mtcars, aes(x = wt, y = mpg)) +
  geom_point(aes(color = as.factor(cyl), size = qsec), alpha = 0.5) +
  scale_size(range = c(0.5, 12)) +
  scale_color_pomological() +
  theme_pomological("Yomogi", 16)

# 加入背景圖片,輸出圖檔
paint_pomological(p, res = 110) %>%
  magick::image_write("output.png")
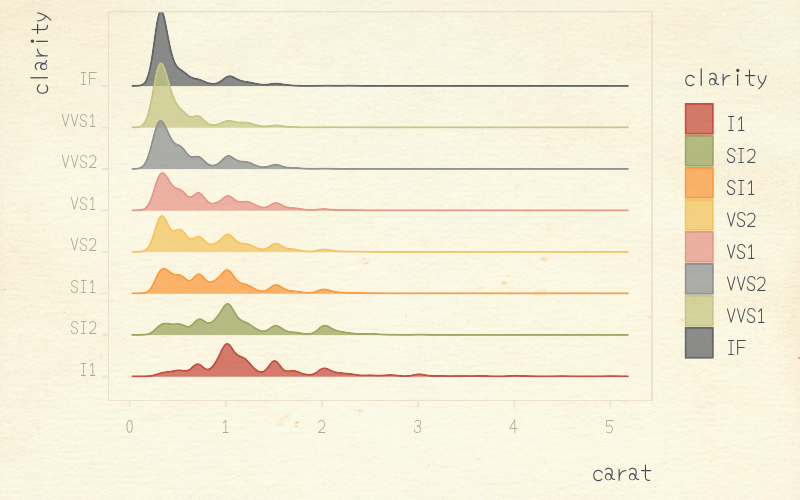
ggpomological 色盤與佈景主題ggpomological 色盤與佈景主題以下是脊線圖套用 ggpomological 色盤與佈景主題的範例:
# 建立脊線圖
p <- ggplot(diamonds) +
  aes(x = carat, y = clarity, color = clarity, fill = clarity) +
  ggridges::geom_density_ridges(alpha = 0.75) +
  theme_pomological(base_family = 'Yomogi', base_size = 16,
    base_theme = ggridges::theme_ridges()) +
  scale_fill_pomological() +
  scale_color_pomological()

# 加入背景圖片,輸出圖檔
paint_pomological(p, res = 110) %>%
  magick::image_write("output.png")
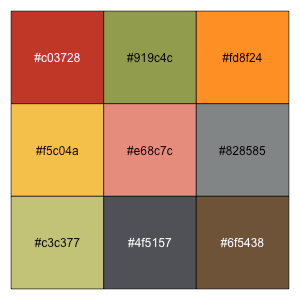
ggpomological 色盤與佈景主題ggpomological 配色若要查看 ggpomological 套件內的原始色碼,可以使用以下指令:
# ggpomological 主要配色
scales::show_col(ggpomological:::pomological_palette)
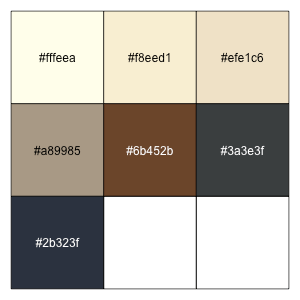
ggpomological 主要配色# ggpomological 次要配色 scales::show_col(unlist(ggpomological:::pomological_base))
ggpomological 次要配色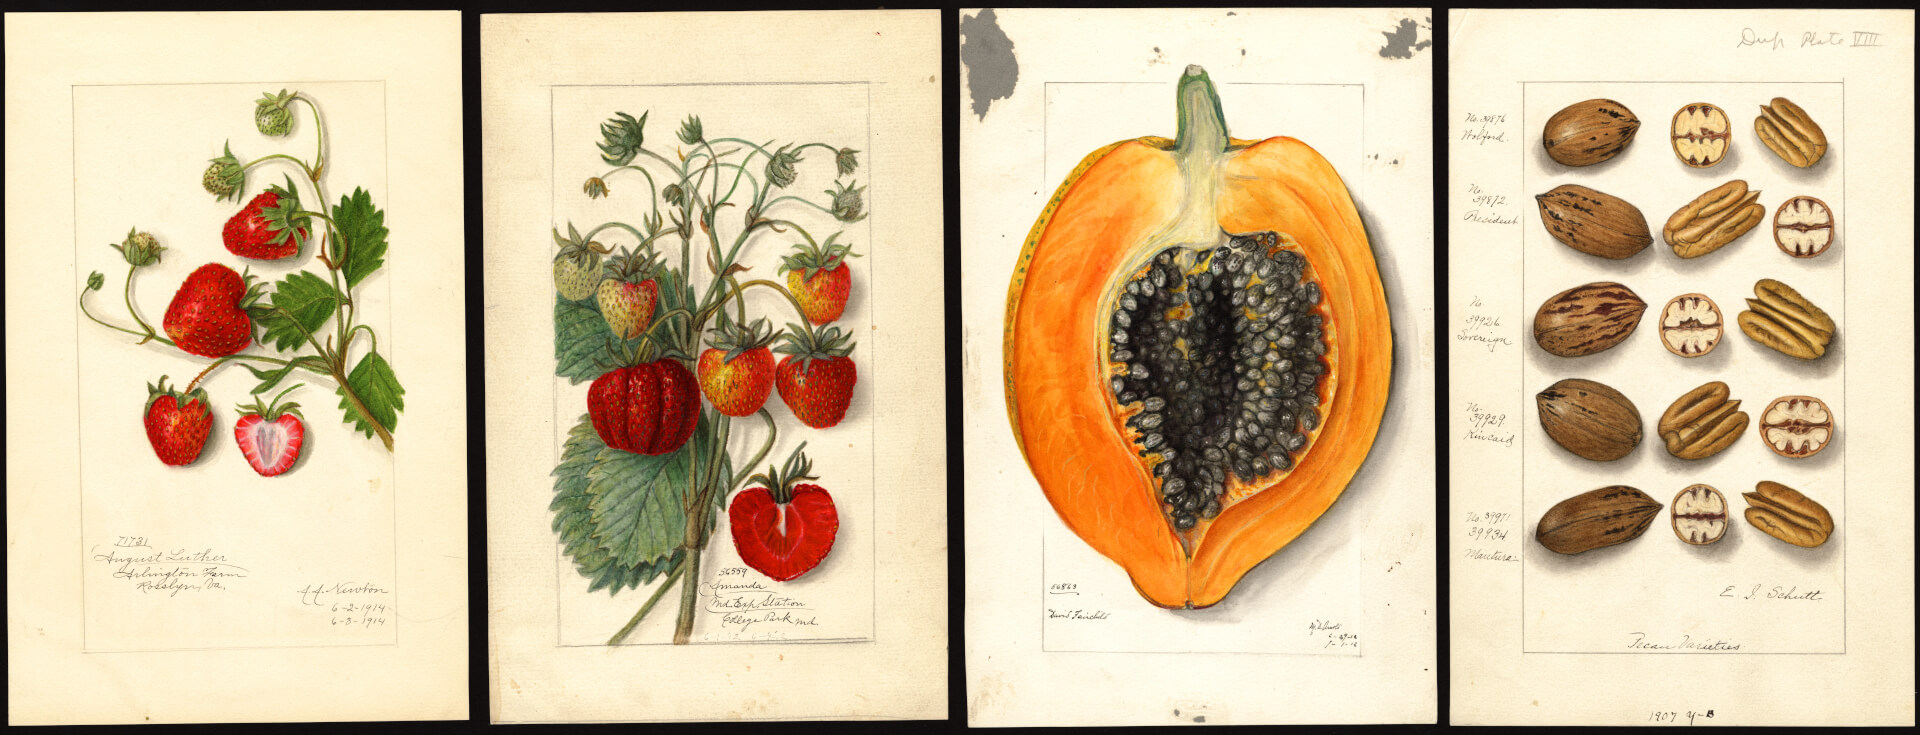