介紹如何使用 R 的 ggplot2 套件繪製高品質的長條圖(bar plot)。
在繪製長條圖之前,先準備好類型名稱 type 與數值 value 的對應表:
# 準備繪製長條圖的資料
my.df <- data.frame(
  type = c("A", "B", "C"),
  value = c(5.6, 7.2, 3.1)
)
查看建立好的資料:
# 查看資料
my.df
  type value
1    A   5.6
2    B   7.2
3    C   3.1
如果原始資料是類別型的,想要計算各類別的出現次數,可以使用 table 函數:
# 類別型原始資料
my.cat.data <- c("A", "C", "B", "C", "A", "A",  "C", "A", "B", "A")

# 計算各類別出現次數
my.cat.df <- data.frame(table(my.cat.data))

# 查看資料
my.cat.df
  my.cat.data Freq
1           A    5
2           B    2
3           C    3
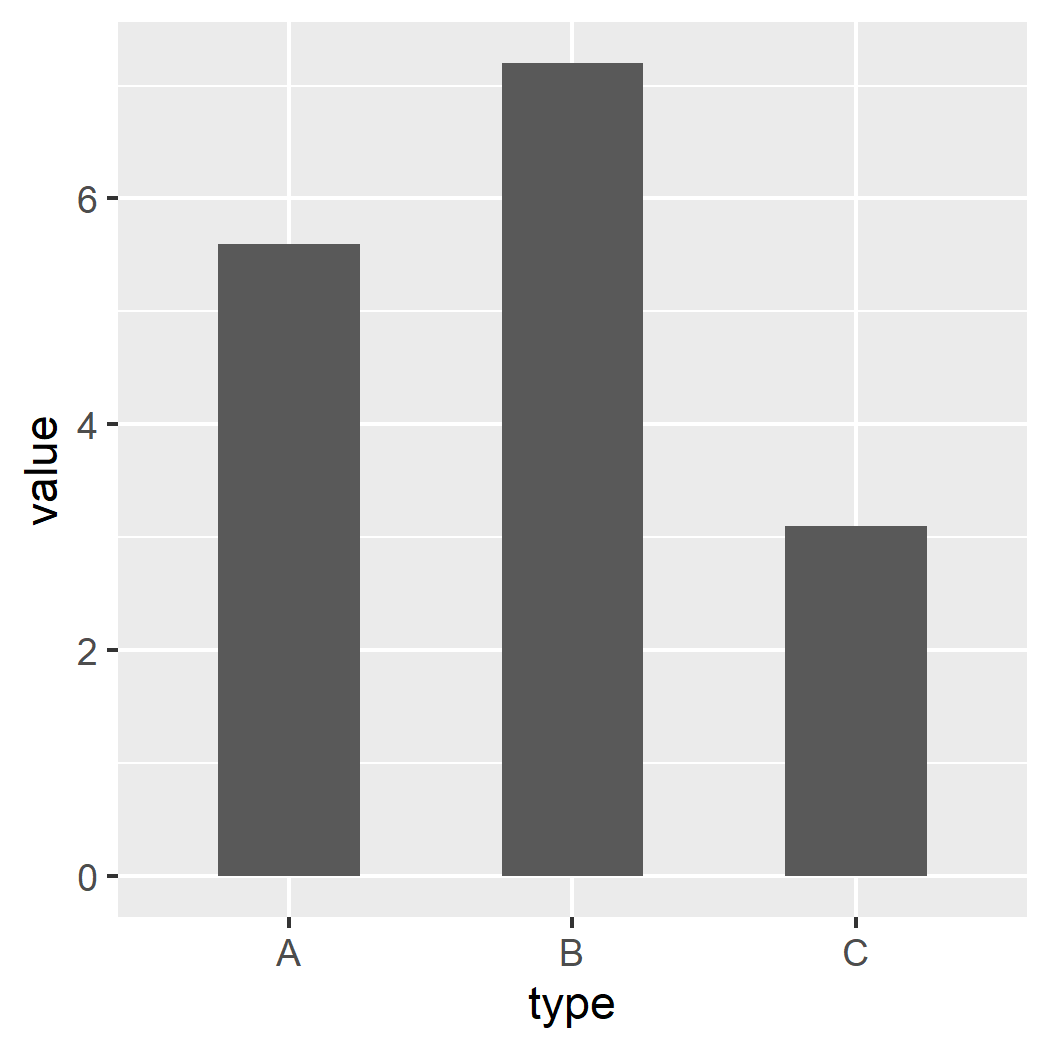
若要使用 ggplot2 套件繪製長條圖,可以使用 geom_bar() 這個幾何圖形:
library(ggplot2)

# 基本長條圖
p <- ggplot(data = my.df, aes(x = type, y = value)) +
  geom_bar(stat = "identity")
p
如果想要繪製橫向的長條圖,可以加上 coord_flip() 將 X 軸與 Y 軸對調,翻轉圖形:
# X 軸與 Y 軸對調
p + coord_flip()
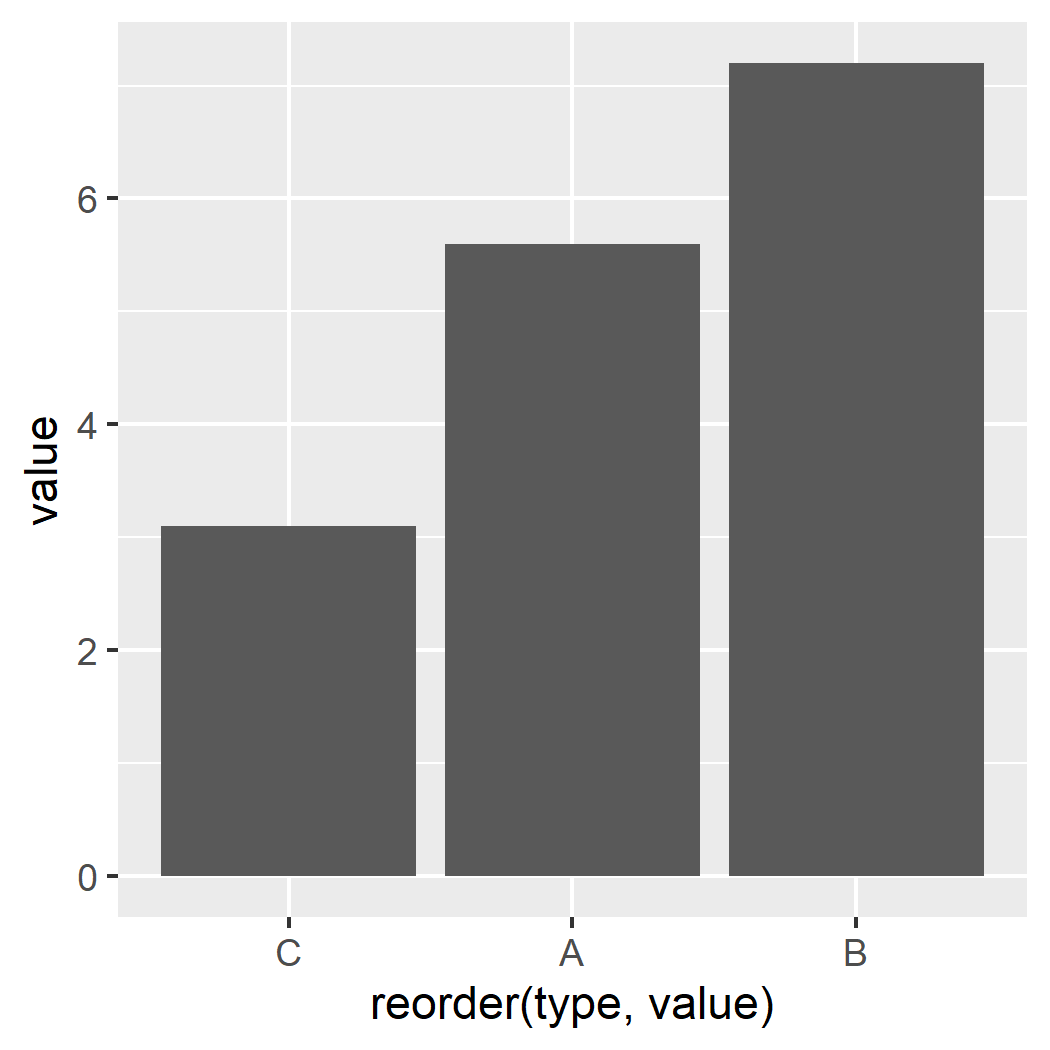
若要依據對應的數值來排序類別,可以使用 reorder() 重新排序類別:
# 依據類別對應的數值排序
p <- ggplot(data = my.df, aes(x = reorder(type, value), y = value)) +
  geom_bar(stat = "identity")
p
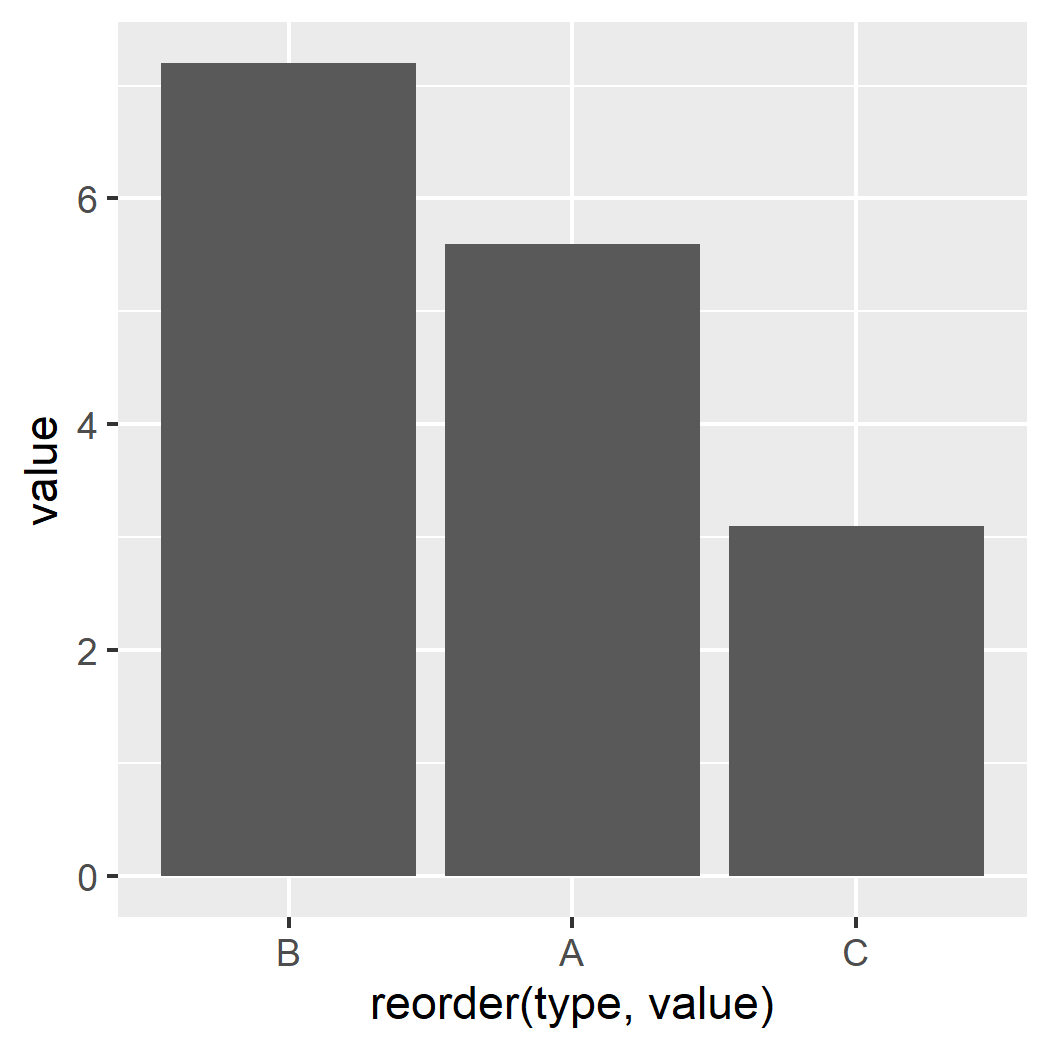
若要將 X 軸的各類別以反向的方式排序,可以使用 scale_x_discrete() 搭配 limits = rev 參數:
# 反向排序
p + scale_x_discrete(limits = rev)
由於這裡使用了 reorder() 重新排序類別,所以 X 軸的標示文字也會自動跟著改變,若要自行指定 X 軸的標示文字,可以使用 xlab() 來處理。
若要調整長條圖的寬度,可以使用 geom_bar() 的 width 參數:
# 調整長條圖寬度
p <- ggplot(data = my.df, aes(x = type, y = value)) +
  geom_bar(stat = "identity", width = 0.5)
p
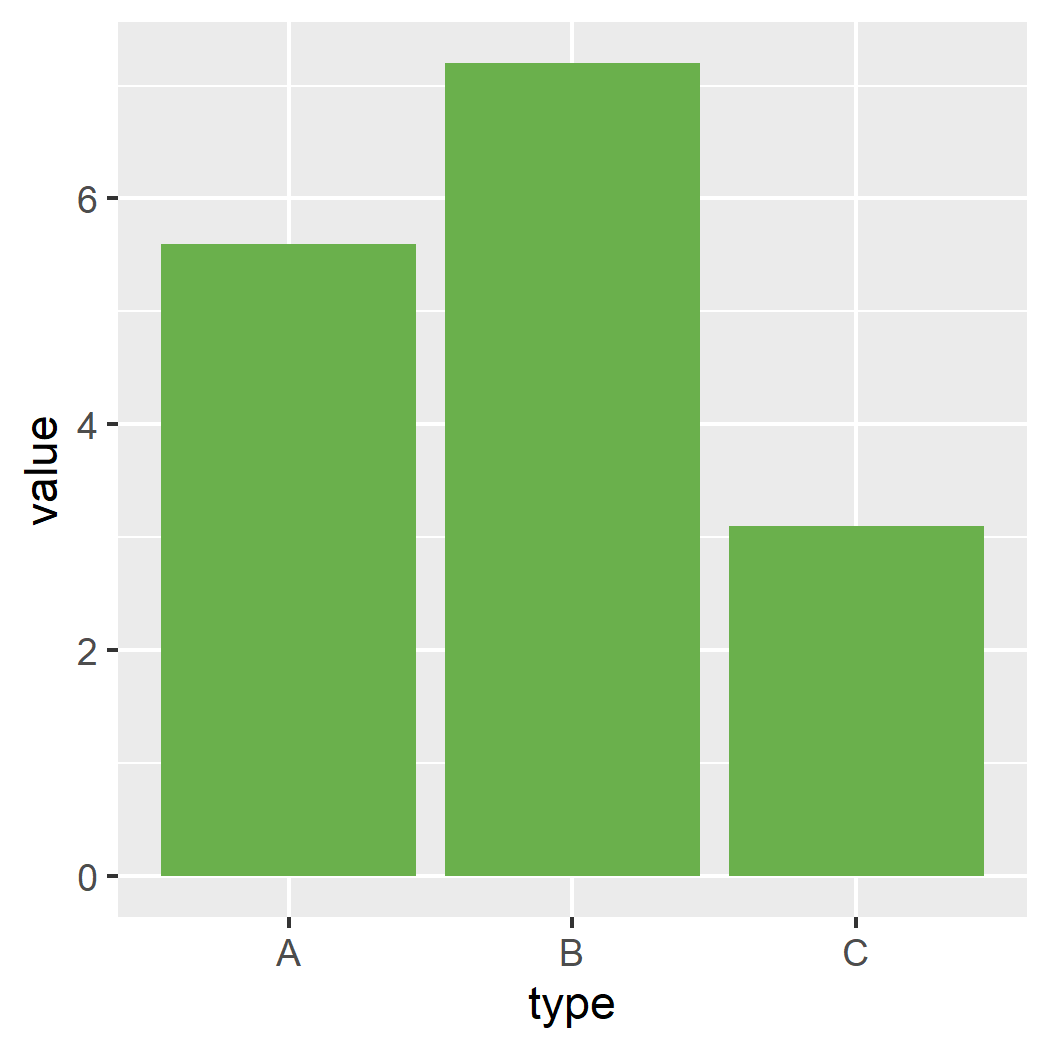
若要調整長條圖的顏色,可以使用 geom_bar() 的 fill 參數指定十六進位的色碼,或是顏色名稱(可用 colors() 查詢 R 中可用的顏色名稱):
# 調整長條圖顏色
p <- ggplot(data = my.df, aes(x = type, y = value)) +
  geom_bar(stat = "identity", fill = "#6ab04c")
p
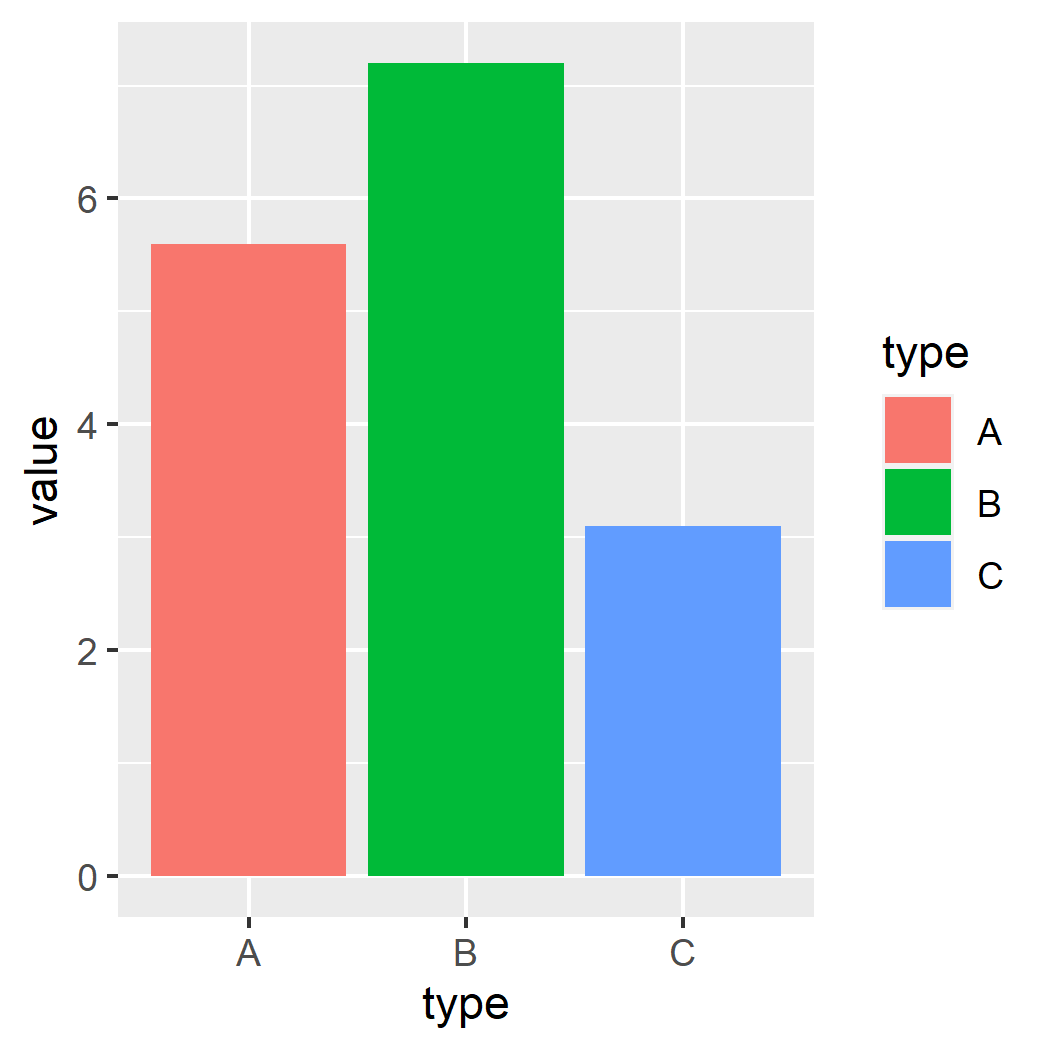
亦可根據不同的 type 設定不同顏色:
# 根據不同的 type 設定不同顏色
p <- ggplot(data = my.df, aes(x = type, y = value, fill = type)) +
  geom_bar(stat = "identity")
p
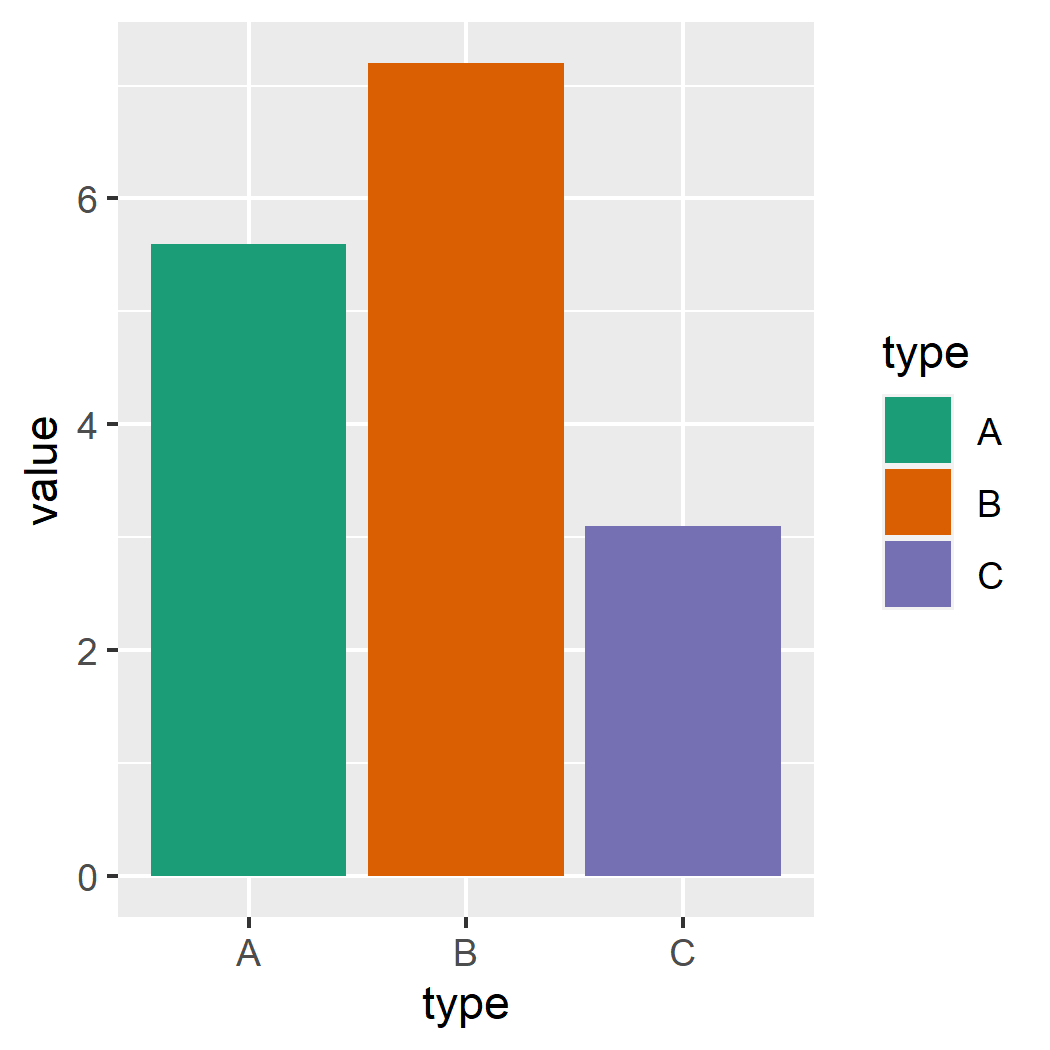
type 設定不同顏色使用 Dark2 色盤:
# 使用 Dark2 色盤
p + scale_fill_brewer(palette = "Dark2")
Dark2 色盤若要查詢可用的色盤,可以參考 scale_colour_brewer 函數的文件,或使用 RColorBrewer 套件的 display.brewer.all 直接顯示每個色盤:
# 查詢可用的色盤
library(RColorBrewer)
display.brewer.all()
我們也可以自行定義色盤:
# 使用自訂色盤
p + scale_fill_manual(values = c("#999999", "#E69F00", "#56B4E9"))
自訂色盤也可以用來標示特定的資料,例如將特別的類別設定為紅色,而其餘設定為灰色。
# 標示特定資料
p + scale_fill_manual(values = c("#999999", "#990000", "#999999")) +
  theme(legend.position = "none") # 不顯示圖例說明
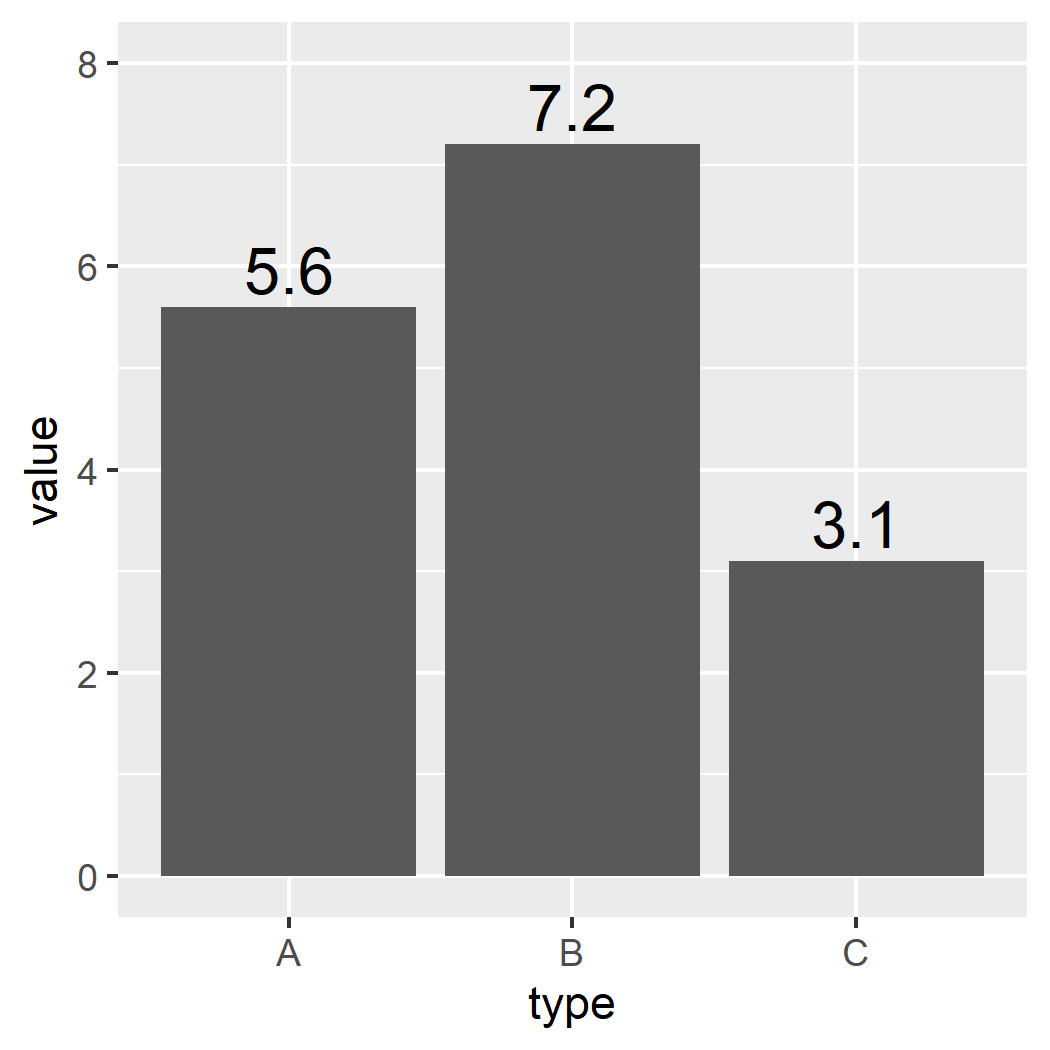
若要在長條圖中以文字標示個別的數值,可以使用 geom_text() 並指定要標示的文字內容,同時以 vjust 與 size 微調文字的位置與大小:
# 長條圖加上標示文字(外部)
p <- ggplot(data = my.df, aes(x = type, y = value)) +
  geom_bar(stat = "identity") +
  geom_text(aes(label = value), vjust = -0.3, size = 5.5) +
  ylim(c(0, 8)) # 避免文字超出繪圖範圍
p
若要將文字放在長條圖內部,可以改變 vjust 的移動方向,並以 color 指定適合的文字顏色:
# 長條圖加上標示文字(內部)
p <- ggplot(data = my.df, aes(x = type, y = value)) +
  geom_bar(stat = "identity") +
  geom_text(aes(label = value), vjust = 1.6, size = 5.5, color = "white")
p
準備具有組別資訊的資料。
# 準備繪製長條圖的資料,具有組別資訊
my.df2 <- data.frame(
  type = c("A", "B", "C", "A", "B", "C"),
  group = c("G1", "G1", "G1", "G2", "G2", "G2"),
  value = c(5.6, 7.2, 3.1, 7.8, 11.2, 2.1)
)
查看建立好的資料:
# 查看資料
my.df2
  type group value
1    A    G1   5.6
2    B    G1   7.2
3    C    G1   3.1
4    A    G2   7.8
5    B    G2  11.2
6    C    G2   2.1
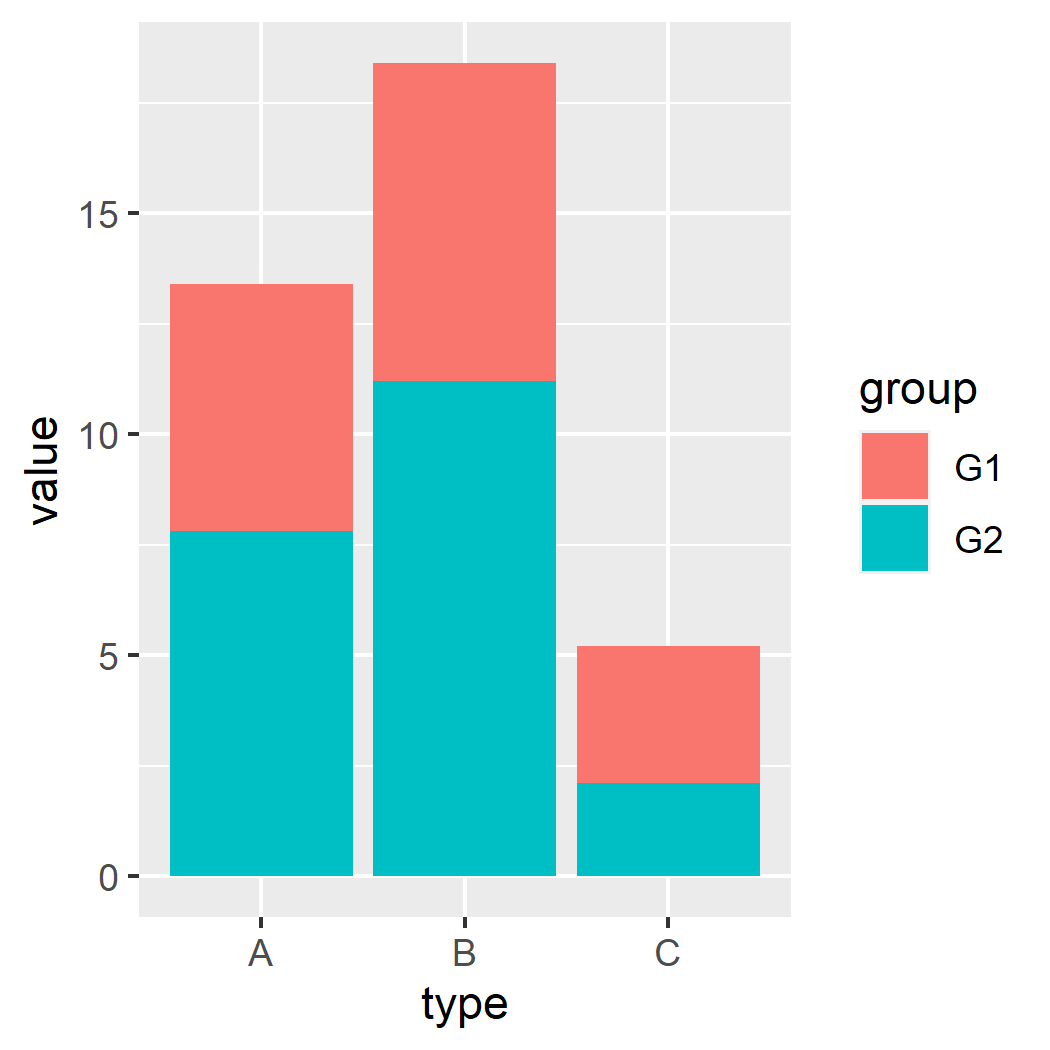
若要根據組別資訊,繪製堆疊長條圖,可以將 fill 參數指定為組別的資訊,就會自動依據組別區分顏色:
# 根據組別資訊,繪製堆疊長條圖
p <- ggplot(data = my.df2, aes(x = type, y = value, fill = group)) +
  geom_bar(stat = "identity")
p
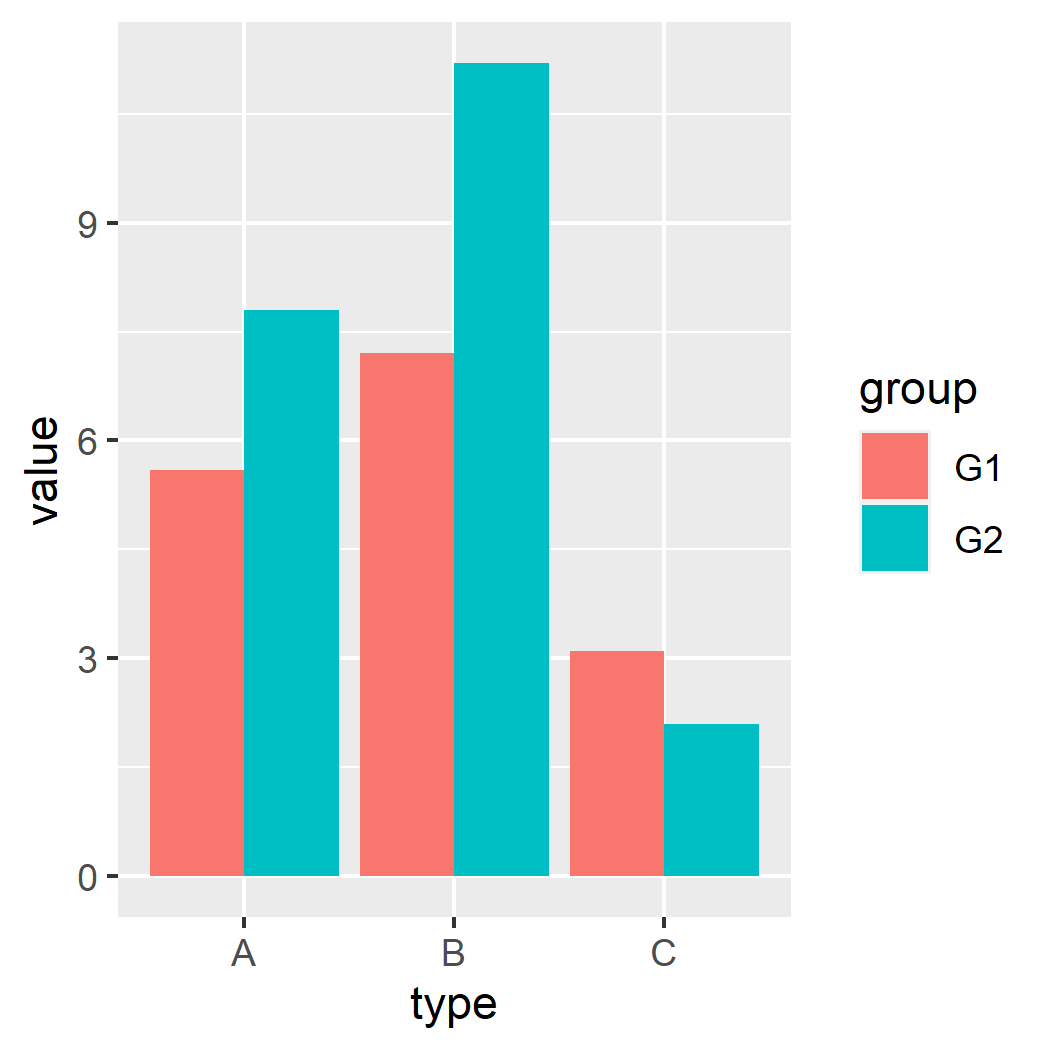
若要堆疊的長條圖改為並排顯示,可以將 geom_bar() 的 position 設定為 position_dodge():
# 根據組別資訊,繪製並排長條圖
p <- ggplot(data = my.df2, aes(x = type, y = value, fill = group)) +
  geom_bar(stat = "identity", position = position_dodge())
p
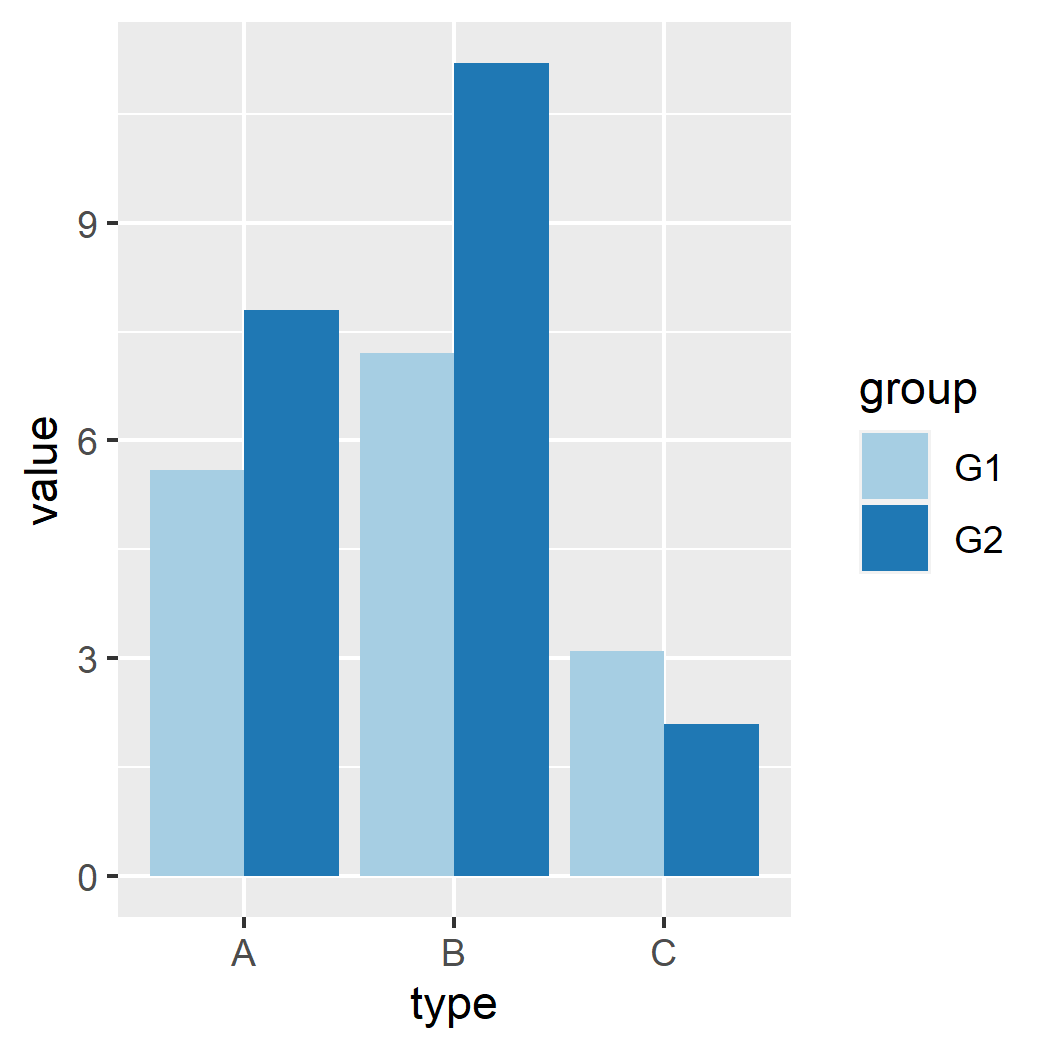
上面介紹過的顏色調整方式,都可以套用在這裡:
# 使用 Paired 色盤
p + scale_fill_brewer(palette = "Paired")
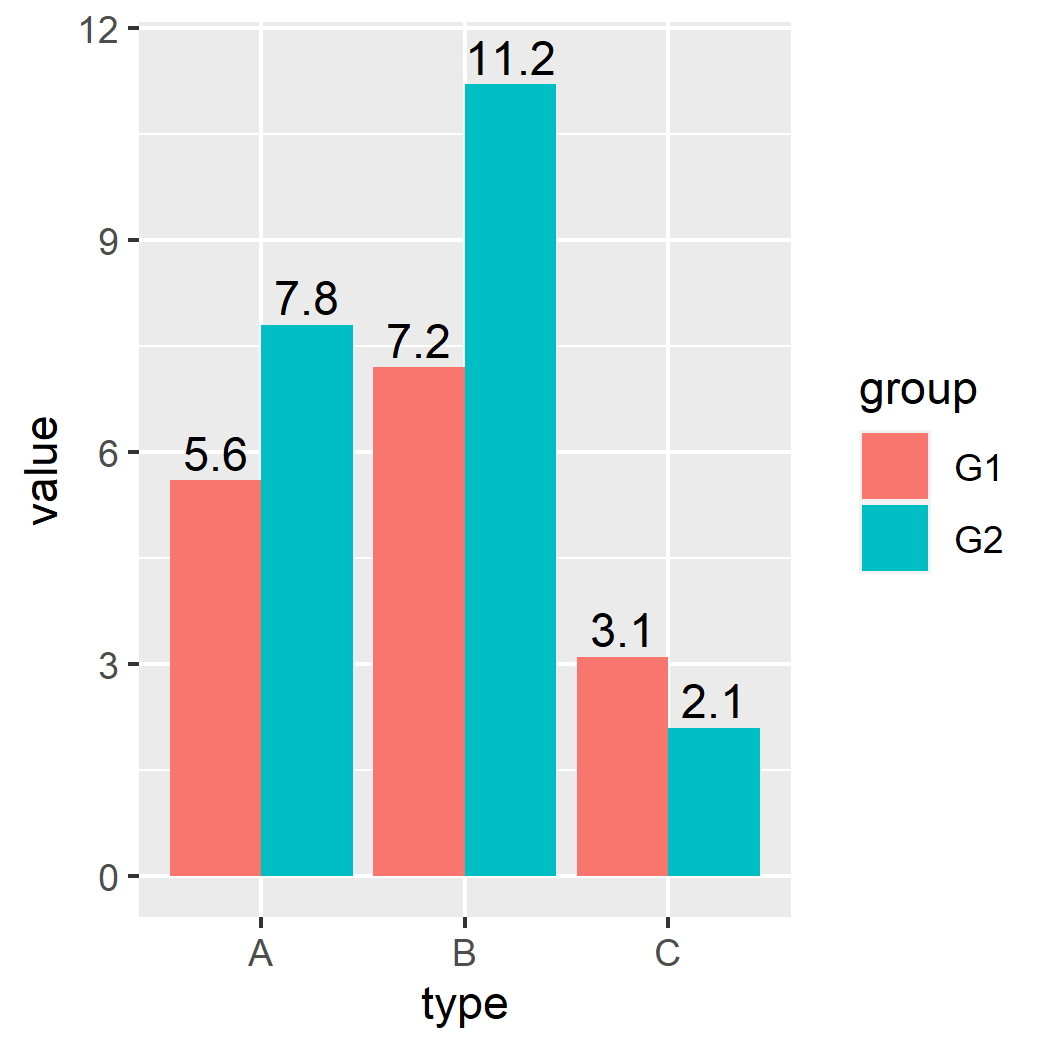
若要在並排長條圖加上標示文字,記得要將 geom_text() 中的 position 設為 position_dodge():
# 並排長條圖加上標示文字(外部)
p <- ggplot(data = my.df2, aes(x = type, y = value, fill = group)) +
  geom_bar(stat = "identity", position = position_dodge()) +
  geom_text(aes(label = value), vjust = -0.3, size = 4.0, position = position_dodge(0.9)) +
  ylim(c(0, 11.5)) # 避免文字超出繪圖範圍
p
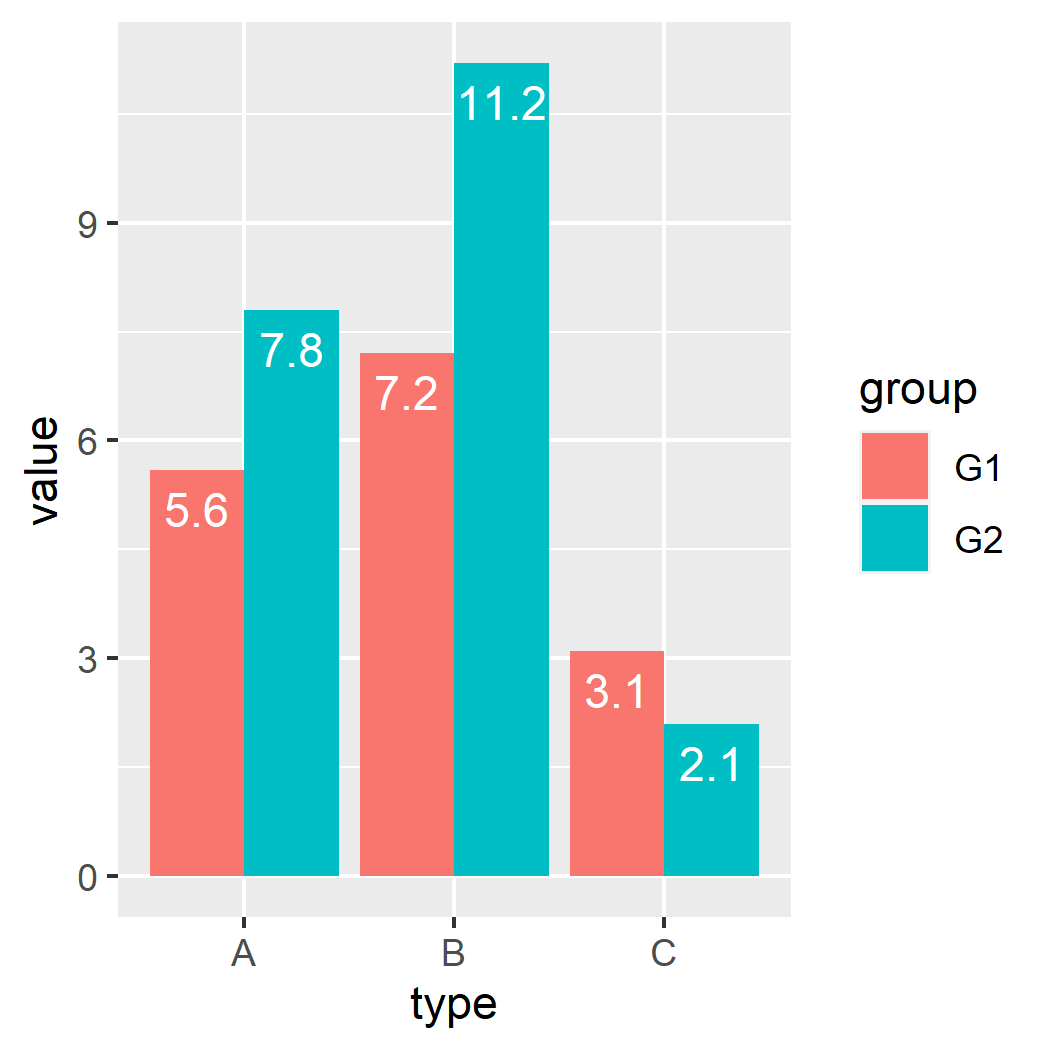
若要將文字放在長條圖內部,作法也是大同小異:
# 並排長條圖加上標示文字(內部)
p <- ggplot(data = my.df2, aes(x = type, y = value, fill = group)) +
  geom_bar(stat = "identity", position = position_dodge()) +
  geom_text(aes(label = value), vjust = 1.6, size = 4.0,
    color = "white", position = position_dodge(0.9))
p
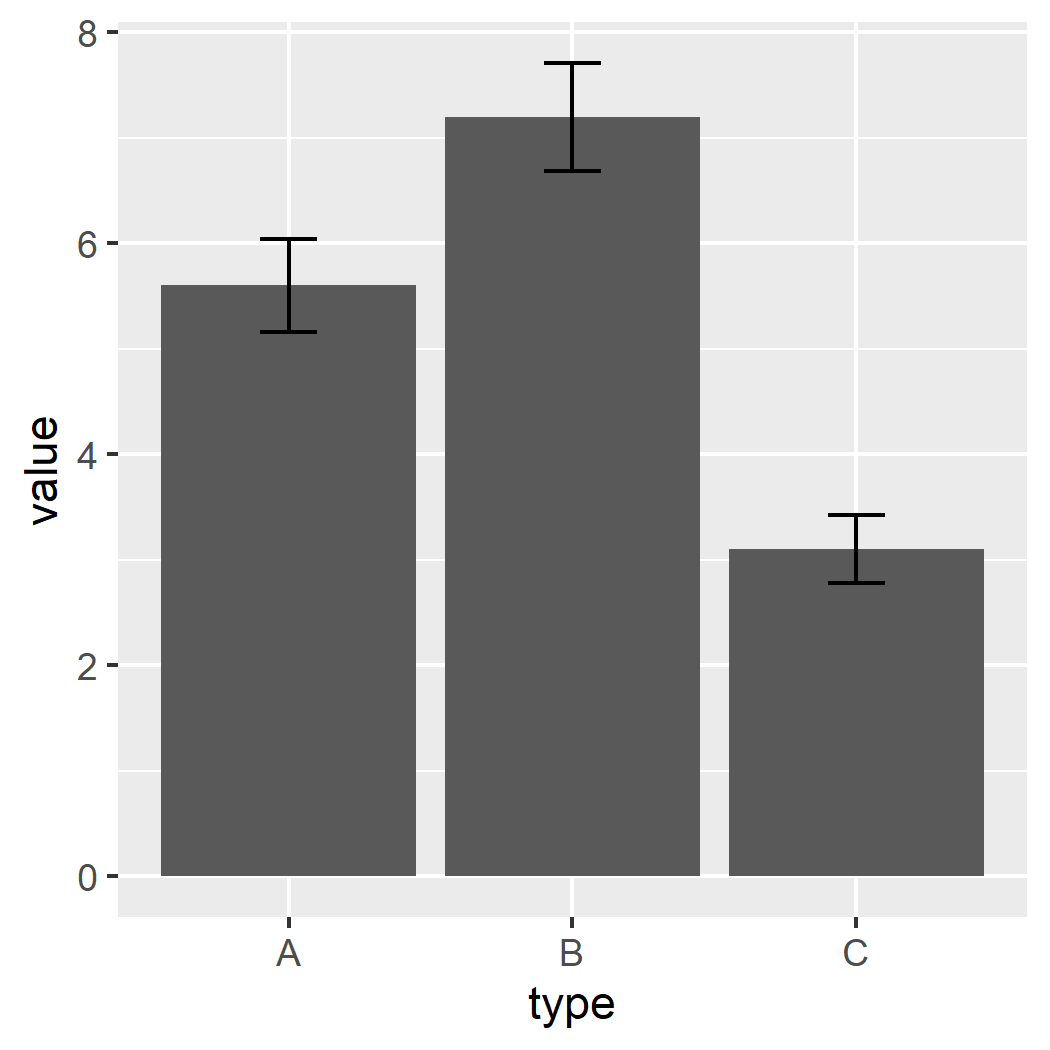
若要在長條圖中加上表示誤差的誤差棒(error bar),可以先準備好含有誤差資訊的資料:
# 準備繪製長條圖的資料,具有誤差資訊
my.df3 <- data.frame(
  type = c("A", "B", "C"),
  value = c(5.6, 7.2, 3.1),
  sd = c(0.44, 0.51, 0.32)
)
再使用 geom_errorbar() 加入誤差棒:
# 長條圖加上誤差棒
p <- ggplot(data = my.df3, aes(x = type, y = value)) +
  geom_bar(stat = "identity") +
  geom_errorbar(aes(ymin = value - sd, ymax = value + sd), width = 0.2)
p
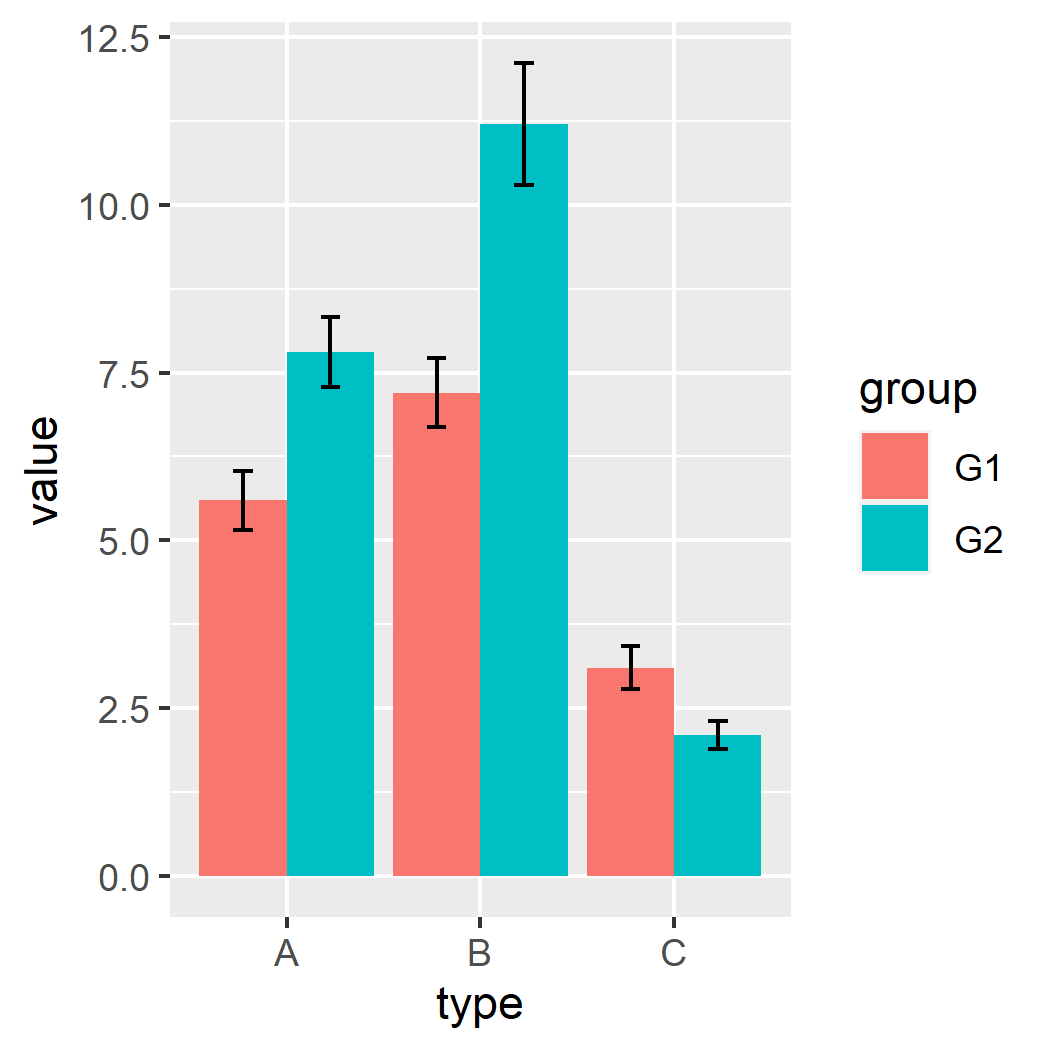
誤差棒亦可用於並排的長條圖中:
# 準備繪製長條圖的資料,具有組別、誤差資訊
my.df4 <- data.frame(
  type = c("A", "B", "C", "A", "B", "C"),
  group = c("G1", "G1", "G1", "G2", "G2", "G2"),
  value = c(5.6, 7.2, 3.1, 7.8, 11.2, 2.1),
  sd = c(0.44, 0.51, 0.32, 0.52, 0.91, 0.21)
)

# 並排長條圖加上誤差棒
p <- ggplot(data = my.df4, aes(x = type, y = value, fill = group)) +
  geom_bar(stat = "identity", position = position_dodge()) +
  geom_errorbar(aes(ymin = value - sd, ymax = value + sd),
    width = 0.2, position = position_dodge(0.9))
p
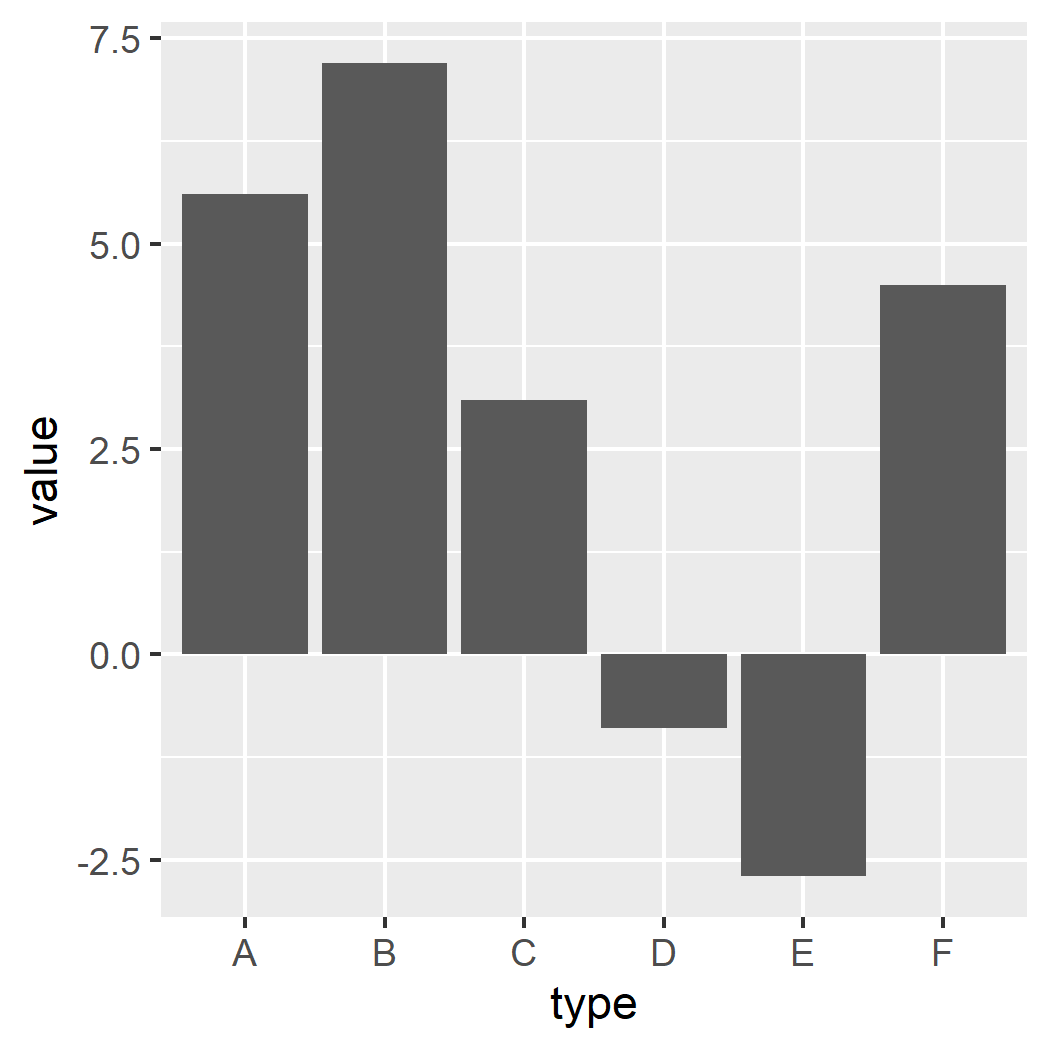
ggplot2 套件也可以繪製含有負值的長條圖,首先準備含有負值的資料:
# 準備繪製長條圖的資料,含有負值
my.df5 <- data.frame(
  type = c("A", "B", "C", "D", "E", "F"),
  value = c(5.6, 7.2, 3.1, -0.9, -2.7, 4.5)
)
按照一般的方式將資料交給 geom_bar() 即可自動繪製出含有負值的長條圖:
# 含有負值的長條圖
p <- ggplot(data = my.df5, aes(x = type, y = value)) +
  geom_bar(stat = "identity")
p
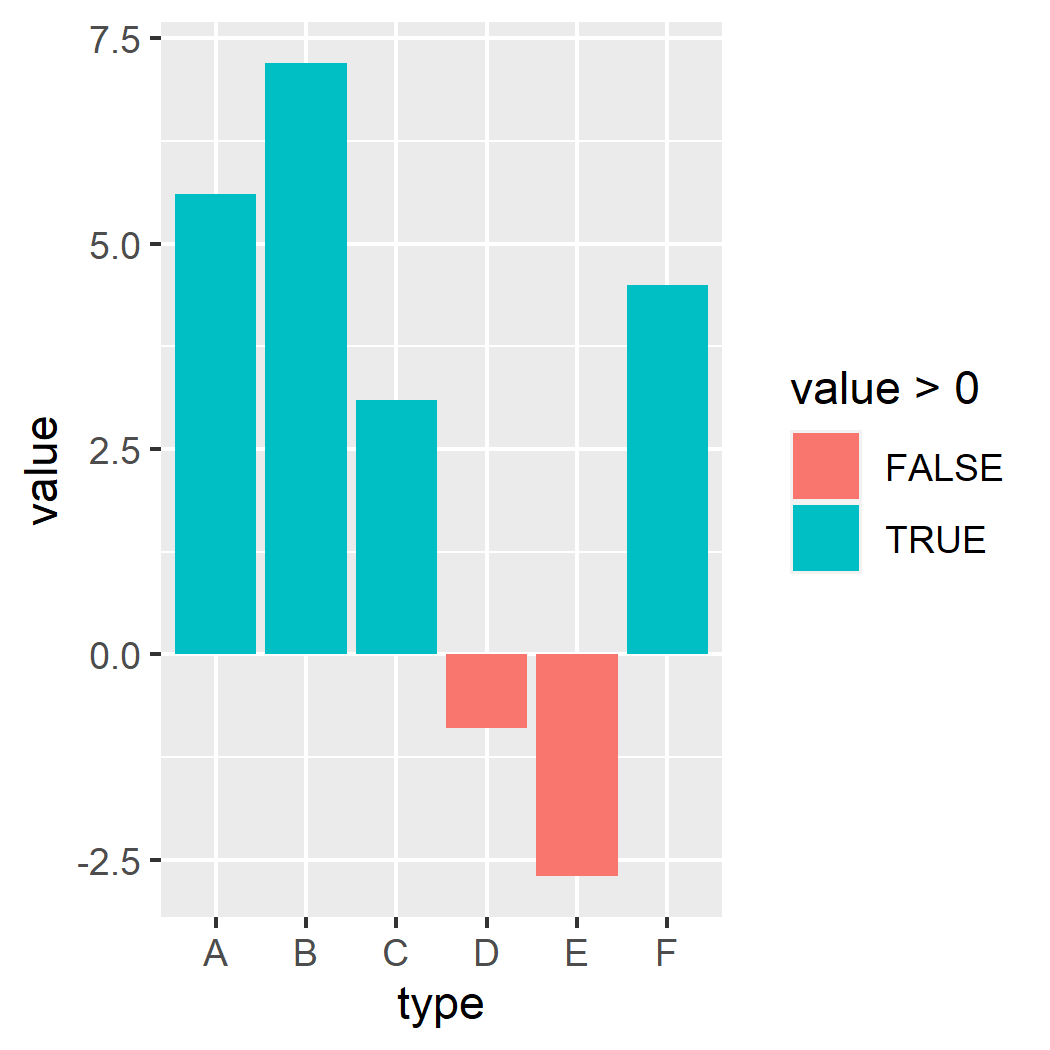
若要以顏色區分正負值,可以透過 fill 來設定:
# 以顏色區分正負值
p <- ggplot(data = my.df5, aes(x = type, y = value, fill = value > 0)) +
  geom_bar(stat = "identity")
p
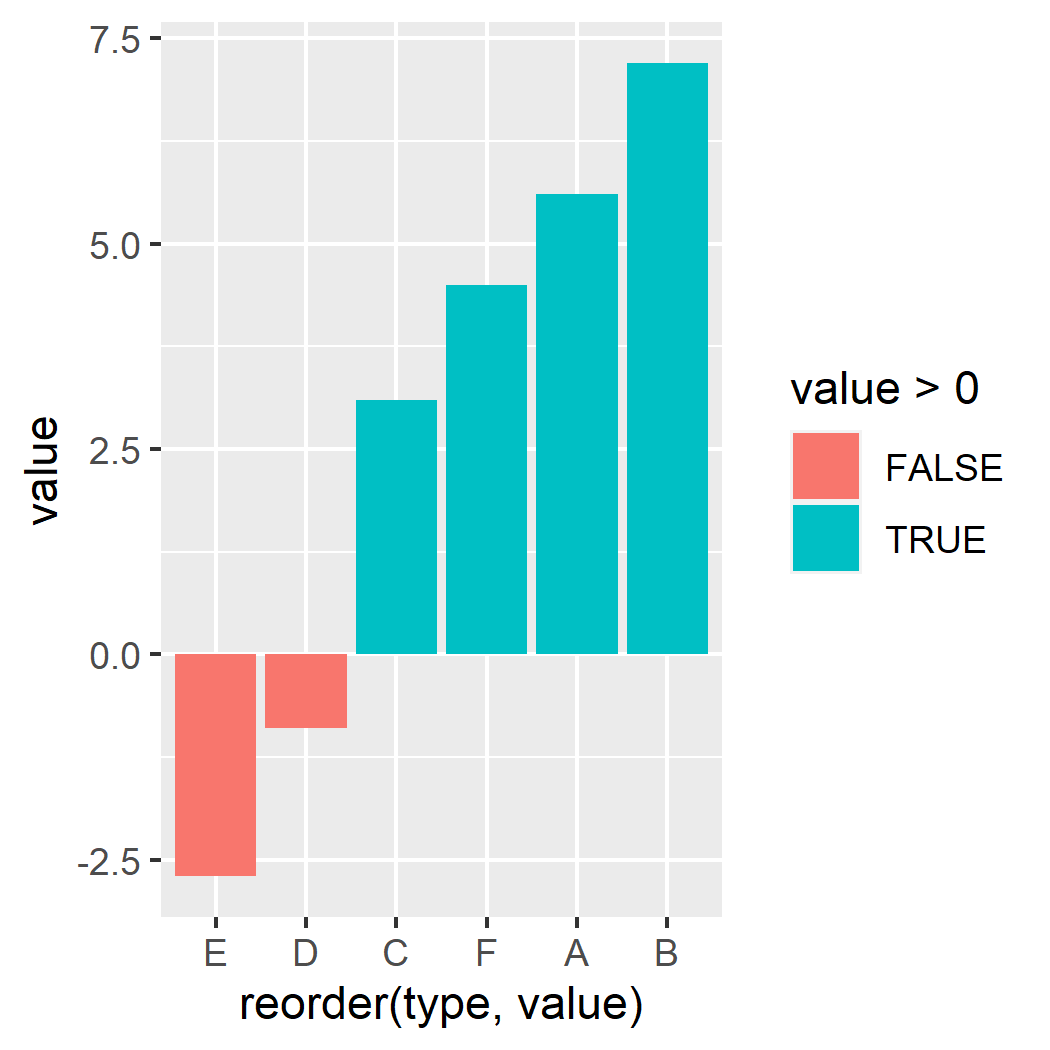
若要依據數值來排序類別,可以使用 reorder() 重新排序類別:
# 依據數值排序
p <- ggplot(data = my.df5, aes(x = reorder(type, value), y = value, fill = value > 0)) +
  geom_bar(stat = "identity")
p