使用 R 建立羅吉斯迴歸模型,預測鐵達尼號乘客存活與否。
鐵達尼號乘客存活的資料集可以從 R 官方收錄的 titanic 套件中取得:
# 安裝 titanic 套件
install.packages("titanic")

# 載入 titanic 套件
library(titanic)
載入套件之後,我們就可以開始使用鐵達尼號乘客存活的資料了。
這個資料集來自於 Kaggle,他將資料區分為訓練模型用的 titanic_train 與測試模型用的 titanic_test,兩個 data frame 的資料欄位都相同,只不過 titanic_test 少了 Survived 的資訊。接下來我們將以 titanic_train 的資料建立模型,然後使用 titanic_test 的資料來做測試。
首先使用 str 查看一下資料的結構:
# 查看資料結構
str(titanic_train)
'data.frame':   891 obs. of  12 variables:
 $ PassengerId: int  1 2 3 4 5 6 7 8 9 10 ...
 $ Survived   : int  0 1 1 1 0 0 0 0 1 1 ...
 $ Pclass     : int  3 1 3 1 3 3 1 3 3 2 ...
 $ Name       : chr  "Braund, Mr. Owen Harris" "Cumings, Mrs. John Bradley (Florence Briggs Thayer)" "Heikkinen, Miss. Laina" "Futrelle, Mrs. Jacques Heath (Lily May Peel)" ...
 $ Sex        : chr  "male" "female" "female" "female" ...
 $ Age        : num  22 38 26 35 35 NA 54 2 27 14 ...
 $ SibSp      : int  1 1 0 1 0 0 0 3 0 1 ...
 $ Parch      : int  0 0 0 0 0 0 0 1 2 0 ...
 $ Ticket     : chr  "A/5 21171" "PC 17599" "STON/O2. 3101282" "113803" ...
 $ Fare       : num  7.25 71.28 7.92 53.1 8.05 ...
 $ Cabin      : chr  "" "C85" "" "C123" ...
 $ Embarked   : chr  "S" "C" "S" "S" ...
titanic_test 的資料結構也是完全相同的:
# 查看資料結構
str(titanic_test)
'data.frame':   418 obs. of  11 variables:
 $ PassengerId: int  892 893 894 895 896 897 898 899 900 901 ...
 $ Pclass     : int  3 3 2 3 3 3 3 2 3 3 ...
 $ Name       : chr  "Kelly, Mr. James" "Wilkes, Mrs. James (Ellen Needs)" "Myles, Mr. Thomas Francis" "Wirz, Mr. Albert" ...
 $ Sex        : chr  "male" "female" "male" "male" ...
 $ Age        : num  34.5 47 62 27 22 14 30 26 18 21 ...
 $ SibSp      : int  0 1 0 0 1 0 0 1 0 2 ...
 $ Parch      : int  0 0 0 0 1 0 0 1 0 0 ...
 $ Ticket     : chr  "330911" "363272" "240276" "315154" ...
 $ Fare       : num  7.83 7 9.69 8.66 12.29 ...
 $ Cabin      : chr  "" "" "" "" ...
 $ Embarked   : chr  "Q" "S" "Q" "S" ...
各個欄位的意義如下:
| 欄位名稱 | 解釋 |
|---|---|
PassengerId |
乘客編號 |
Survived |
是否存活(0:否、1:是) |
Pclass |
社會經濟地位等級(1:高等、2:中等、3:低等) |
Name |
姓名 |
Sex |
性別 |
Age |
年齡(XX.5 表示預估年齡) |
SibSp |
在船上的兄弟姊妹及配偶總數 |
Parch |
在船上的父母及子女總數 |
Ticket |
船票編號 |
Fare |
票價 |
Cabin |
座艙編號 |
Embarked |
登船港口(C:法國瑟堡、Q:紐西蘭皇后鎮、S:英格蘭南安普敦) |
在 Cabin 與 Embarked 的資料中,有包含一些空字串,我們先統一將空字串設定為 NA:
# 將空字串設定為 NA
titanic_train$Cabin[titanic_train$Cabin==""] <- NA
titanic_train$Embarked[titanic_train$Embarked==""] <- NA

titanic_test$Cabin[titanic_test$Cabin==""] <- NA
titanic_test$Embarked[titanic_test$Embarked==""] <- NA
接著將幾個類別型的資料轉為因子(factor):
# 將類別型的資料轉為因子
titanic_train$Sex <- factor(titanic_train$Sex)
titanic_train$Pclass <- factor(titanic_train$Pclass)
titanic_train$Cabin <- factor(titanic_train$Cabin)
titanic_train$Embarked <- factor(titanic_train$Embarked)

titanic_test$Sex <- factor(titanic_test$Sex)
titanic_test$Pclass <- factor(titanic_test$Pclass)
titanic_test$Cabin <- factor(titanic_test$Cabin)
titanic_test$Embarked <- factor(titanic_test$Embarked)
檢查資料的缺失值(NA)狀況:
# 檢查 NA 的數量
sapply(titanic_train,function(x) sum(is.na(x)))
PassengerId    Survived      Pclass        Name         Sex         Age       SibSp
          0           0           0           0           0         177           0
      Parch      Ticket        Fare       Cabin    Embarked
          0           0           0         687           2
# 檢查 NA 的數量
sapply(titanic_test,function(x) sum(is.na(x)))
PassengerId      Pclass        Name         Sex         Age       SibSp       Parch
          0           0           0           0          86           0           0
     Ticket        Fare       Cabin    Embarked
          0           1         327           0
檢查個欄位資料的不重複值數量:
# 檢查不重複值的數量
sapply(titanic_train, function(x) length(unique(x)))
PassengerId    Survived      Pclass        Name         Sex         Age       SibSp
        891           2           3         891           2          89           7
      Parch      Ticket        Fare       Cabin    Embarked
          7         681         248         148           4
# 檢查不重複值的數量
sapply(titanic_test, function(x) length(unique(x)))
PassengerId      Pclass        Name         Sex         Age       SibSp       Parch
        418           3         418           2          80           7           8
     Ticket        Fare       Cabin    Embarked
        363         170          77           3
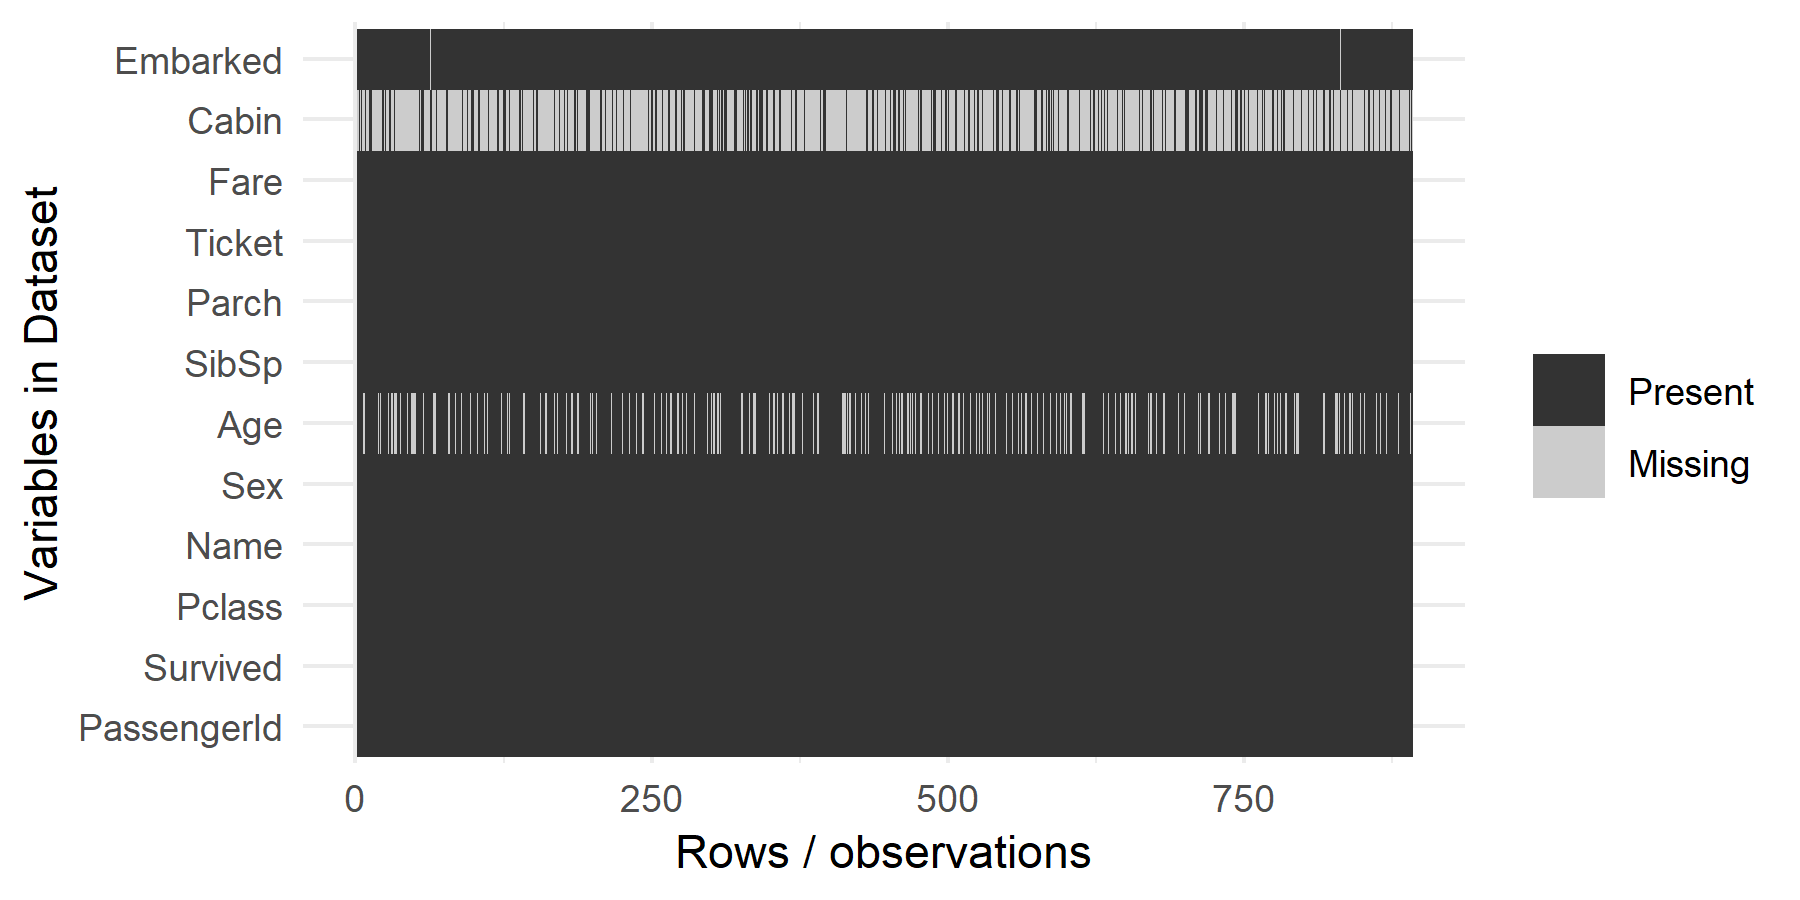
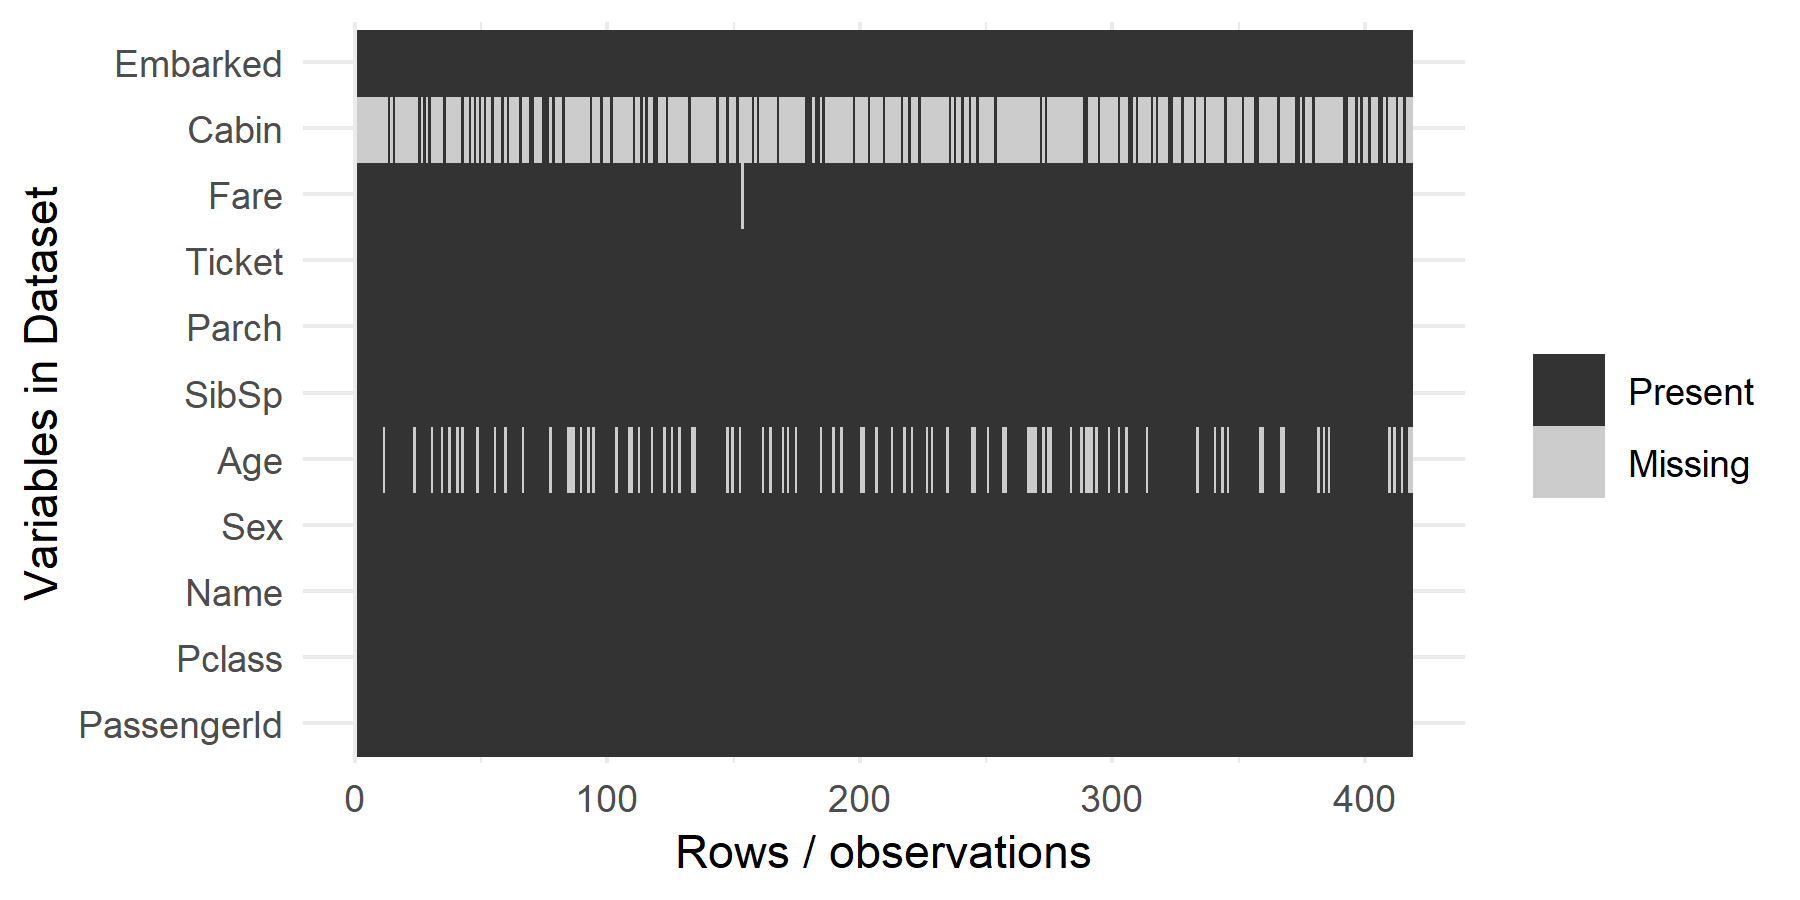
將缺失值的狀況畫出來看一下:
# 繪製缺失值狀況(ggplot 畫法)
library(dplyr)
library(reshape2)
library(ggplot2)
ggplot_missing <- function(x){
  x %>%
    is.na %>%
    melt %>%
    ggplot(data = .,
           aes(x = Var1,
               y = Var2)) +
    geom_raster(aes(fill = value)) +
    scale_fill_grey(name = "",
                    labels = c("Present","Missing")) +
    theme_minimal() +
    theme(axis.text.x  = element_text()) +
    labs(x = "Rows / observations",
         y = "Variables in Dataset")
}
ggplot_missing(titanic_train)
ggplot_missing(titanic_test)
缺失值的圖也可以使用 Amelia 套件來畫,圖形都類似。
# 繪製缺失值狀況(傳統畫法)
install.packages("Amelia")
library(Amelia)
missmap(titanic_train)
missmap(titanic_test)
在這些資料中,有些變數看起來就跟存活與否沒有什麼關係(例如姓名),所以先將沒有用處的變數剔除,只留下有用的變數:
# 篩選有用的變數
titanic_train <- subset(titanic_train, select = c(Sex, Age, Pclass, SibSp, Parch, Fare, Embarked, Survived))
titanic_test <- subset(titanic_test, select = c(Sex, Age, Pclass, SibSp, Parch, Fare, Embarked))
在年齡的資料中,包含了大量的 NA,這種問題的處理方式有很多種,可以使用平均值、中位數或眾數來取代 NA,這裡我們以平均值來取代之:
# 使用平均年齡取代年齡的 NA
avg.age = mean(c(titanic_train$Age, titanic_test$Age), na.rm = T)
titanic_train$Age[is.na(titanic_train$Age)] = avg.age
titanic_test$Age[is.na(titanic_test$Age)] = avg.age
Embarked 與 Fare 兩個變數中也含有 NA,不過量不多,所以我們直接將含有 NA 的資料刪除:
# 刪除含有 NA 的資料
titanic_train = titanic_train[!is.na(titanic_train$Embarked),]
titanic_test = titanic_test[!is.na(titanic_test$Fare),]
使用 glm 建立一個羅吉斯迴歸模型:
# 建立迴歸模型
reg.model = glm(Survived ~., family = binomial(link = 'logit'), data = titanic_train)
summary(reg.model)
Call:
glm(formula = Survived ~ ., family = binomial(link = "logit"),
    data = titanic_train)

Deviance Residuals:
    Min       1Q   Median       3Q      Max
-2.6240  -0.6098  -0.4240   0.6111   2.4510

Coefficients:
             Estimate Std. Error z value Pr(>|z|)
(Intercept)  4.106628   0.476646   8.616  < 2e-16 ***
Sexmale     -2.709536   0.201347 -13.457  < 2e-16 ***
Age         -0.039367   0.007889  -4.990 6.02e-07 ***
Pclass2     -0.925239   0.297932  -3.106  0.00190 **
Pclass3     -2.150054   0.297752  -7.221 5.16e-13 ***
SibSp       -0.322293   0.109595  -2.941  0.00327 **
Parch       -0.095458   0.119045  -0.802  0.42263
Fare         0.002257   0.002462   0.917  0.35936
EmbarkedQ   -0.026843   0.381586  -0.070  0.94392
EmbarkedS   -0.446383   0.239749  -1.862  0.06262 .
---
Signif. codes:  0 ‘***’ 0.001 ‘**’ 0.01 ‘*’ 0.05 ‘.’ 0.1 ‘ ’ 1

(Dispersion parameter for binomial family taken to be 1)

    Null deviance: 1182.82  on 888  degrees of freedom
Residual deviance:  783.67  on 879  degrees of freedom
AIC: 803.67

Number of Fisher Scoring iterations: 5
模型建立好之後,即可預測 titanic_test 的 Survived:
# 預測 titanic_test 的 Survived
result <- predict(reg.model, newdata = titanic_test, type = 'response')
參考資料:datascience+、R 的世界、RPubs、RPubs、Kaggle、Kaggle、Kaggle、r-statistics.co